Figures & data
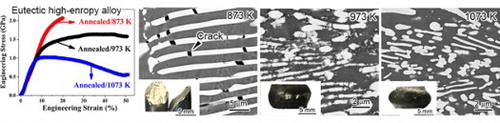
Figure 1. (a,b) X-ray diffraction patterns of the as-homogenized and annealed EHEAs, (c, d) low magnification BSE-SEM images showing eutectic cells and (e, f) are corresponding enlarged views showing a lamellar structure.
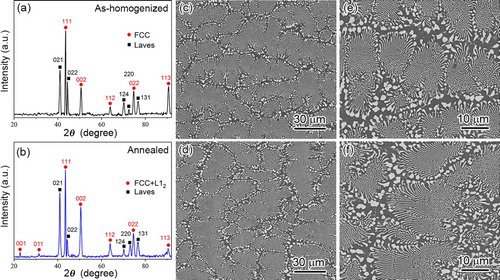
Figure 2. (a) HAADF-STEM and corresponding elemental STEM-EDS maps of Ni, Ta, Fe, Co, Cr, Al and Zr, respectively. (b, c) HRTEM images and SAED patterns (right panel) of the as-homogenized and annealed samples, respectively.
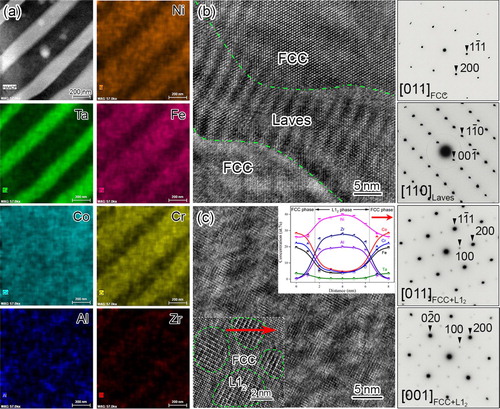
Table 1. Chemical compositions of the constituent phases in the annealed EHEA samples before and after compression at 1073 K.
Figure 3. (a) Temporal evolution of the Vickers hardness of the as-homogenized sample annealed at 873 K, (b, c) compressive engineering stress-strain curves of the as-homogenized and annealed EHEAs at 973–1273 K, (d) plot of temperature dependence on 0.2 offset yield strength values.
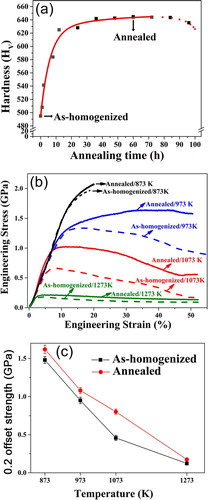
Table 2. Compressive yield strength (σ0.2), peak yield strength (σp) and fracture strain (δ) of the as-homogenized and annealed EHEAs compared with the previously studied EHEAs [Citation11,Citation15,Citation16].
Figure 4. (a, b, c) Low magnification and (d, e, f) enlarged SEM BSE images showing post-deformation microstructures of the annealed EHEA samples compressed at 873, 973, and 1073 K, respectively.
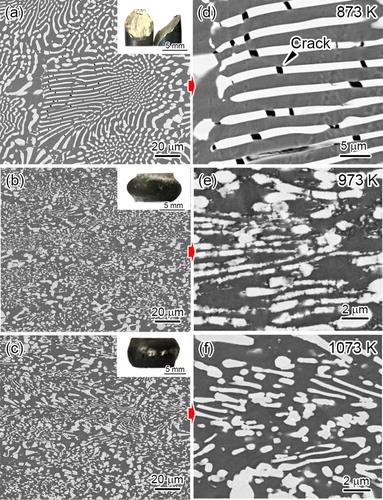
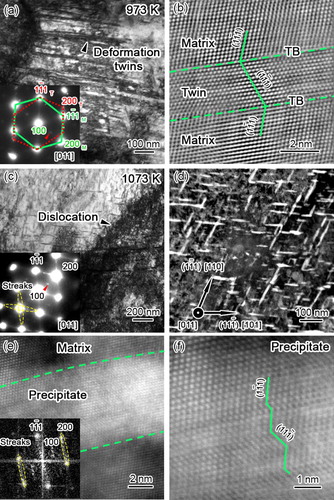
Figure 5. Post-deformation microstructures of the annealed EHEA samples compressed at 973 and 1073 K. (a, c) Bright-field (BF)-TEM image with inserted SAED patterns; (b, d) HAADF-STEM image showing a deformation twin and precipitates in the annealed samples compressed at 973 and 1073 K, respectively; (e) high resolution HAADF-STEM image showing the structures of the precipitate and matrix phases; (f) enlarged view showing faulted 111-type planes within the precipitate phase.