Figures & data
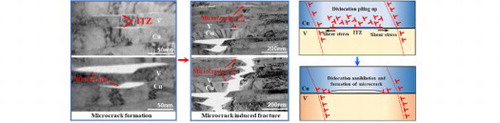
Figure 1. Interface structures in the as-fabricated Cu/V NMMs. (a–b) Typical TEM images of sharp interfaces and ITZs. (c–d) HRTEM images of sharp interfaces and ITZs. (e–f) Orientation relationships near the sharp interfaces and ITZs.
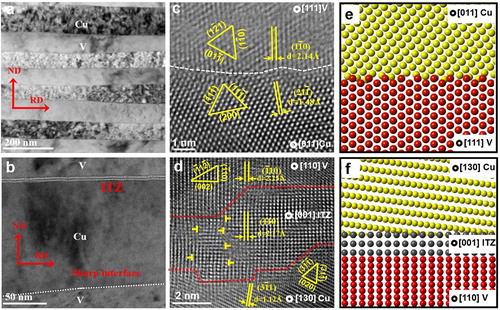
Figure 2. Fracture testing design and sequential TEM images of fracture behavior of Cu/V NMMs. (a) Schematic of in situ testing design. (b) Typical morphology of FIB-fabricated sample. (c–f) Microcrack-mediated fracture process in Cu/V NMMs.
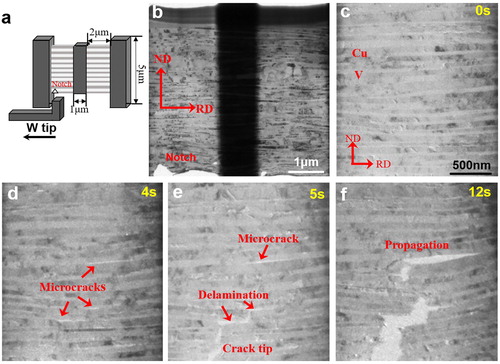
Figure 3. Sequential TEM images of ITZ-mediated fracture in Cu/V NMMs. (a) Sample morphology before loading. (b–f) Zoomed-in TEM images of ITZs-mediated fracture process. (g–i) Fracture of Cu/V NMMs dominated by the sharp interfaces. (j) Zoomed-in TEM images of the fracture surfaces.
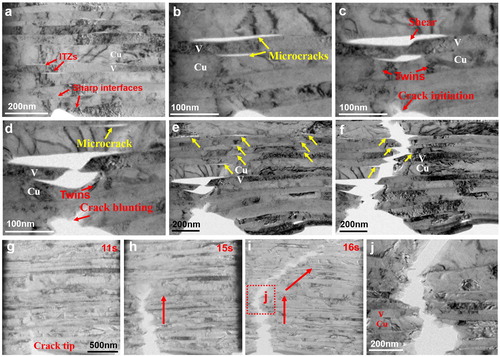
Figure 4. Schematic of the effects of slip discontinuity. (a) Slip continuity at sharp interfaces and ITZs. (b) Schematic of the formation of ITZs. (c) Schematic of the fracture process dominated by different interfaces.
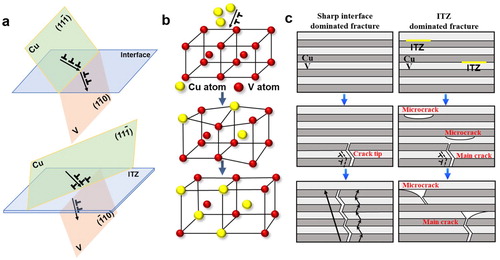
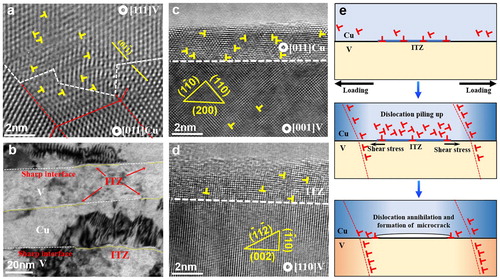
Figure 5. Effects of sharp interfaces and ITZs on deformation. (a) Interface reconstruction at the sharp interface near the crack. (b) Dislocation piling up near the ITZs. (c) HRTEM images of fractured Cu and V layers bonded by sharp interfaces. (d) Fracture propagated along the ITZ. (e) Schematic of the formation mechanism of microcracks.