
Figures & data
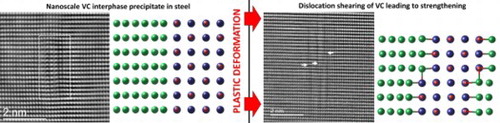
Figure 1. Interphase precipitation in the steel after thermo-mechanical processing: a. Bright field image and (b) associated selected area diffraction pattern with zone axis . The additional unindexed diffraction spots originate from (Nb,V)C particles formed in austenite; c. Dark field image taken using the
reflection in b. d HR-STEM micrograph showing rows of interphase precipitates marked with red ovals; e. V EDS map showing two rows of VC marked with red ovals. f. A representative HAADF-STEM atomically resolved micrograph of carbide particle in bcc matrix down the
zone axis. Carbide particle is outlined by the dash lines.
![Figure 1. Interphase precipitation in the steel after thermo-mechanical processing: a. Bright field image and (b) associated selected area diffraction pattern with zone axis [011]α||[010]VC. The additional unindexed diffraction spots originate from (Nb,V)C particles formed in austenite; c. Dark field image taken using the 200VC reflection in b. d HR-STEM micrograph showing rows of interphase precipitates marked with red ovals; e. V EDS map showing two rows of VC marked with red ovals. f. A representative HAADF-STEM atomically resolved micrograph of carbide particle in bcc matrix down the [011]α zone axis. Carbide particle is outlined by the dash lines.](/cms/asset/f200ecd3-ea7b-4827-b5fc-719e3cf229ed/tmrl_a_1764121_f0001_oc.jpg)
Figure 2. DFT simulation of the a. (100)α||(100)VC, [011]α||[010]VC interface and b. (011)α||(010)VC, [100]α||[100]VC interface. c. Bright Field (BF)-STEM image with overlay α||[010]VC zone axis view of the model (upper black box) and the corresponding simulated BF-STEM image from the DFT model in (b) (lower red box). The intensity profiles originate from the arrows within the images with their respective colour (bottom). Fe atoms- green, V- blue and C-red.
![Figure 2. DFT simulation of the a. (100)α||(100)VC, [011]α||[010]VC interface and b. (011)α||(010)VC, [100]α||[100]VC interface. c. Bright Field (BF)-STEM image with overlay [011]α||[010]VC zone axis view of the model (upper black box) and the corresponding simulated BF-STEM image from the DFT model in (b) (lower red box). The intensity profiles originate from the arrows within the images with their respective colour (bottom). Fe atoms- green, V- blue and C-red.](/cms/asset/06252899-513b-4b3f-a1b2-c49fa2800744/tmrl_a_1764121_f0002_oc.jpg)
Figure 3. STEM-HAADF images of VC after deformation: a., b. and c. Ex-situ uniaxial tensile test and d. In-situ compression of pillars. Arrows indicate the steps at the particle/matrix interfaces. The matrix is imaged down the zone axis.
![Figure 3. STEM-HAADF images of VC after deformation: a., b. and c. Ex-situ uniaxial tensile test and d. In-situ compression of pillars. Arrows indicate the steps at the particle/matrix interfaces. The matrix is imaged down the [011]α zone axis.](/cms/asset/ad5a9fbc-046d-416f-9c93-c258a83b9356/tmrl_a_1764121_f0003_ob.jpg)
Figure 4. DFT simulation results of interfaces after imposed shear
on the
matrix and VC precipitate: a. before relaxation, b. after relaxation and c. electron density state after relaxation. The in-plane component of the shear is
and the out-of-plane component is
. Fe atoms- green, V atoms- blue and C atoms- red.
![Figure 4. DFT simulation results of (100)α||(100)VC,[01¯1]α||[001]VC interfaces after imposed shear b→α:aα2[1¯11] on the α matrix and VC precipitate: a. before relaxation, b. after relaxation and c. electron density state after relaxation. The in-plane component of the shear is bα∗→:aα2[1¯00] and the out-of-plane component is aα2[011]. Fe atoms- green, V atoms- blue and C atoms- red.](/cms/asset/576a3ab7-3f55-4371-b595-ab1c1c439330/tmrl_a_1764121_f0004_oc.jpg)