Figures & data
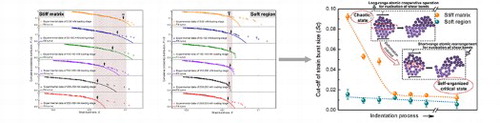
Figure 1. (a) A roughness image of the polished surface. (b) Profiles of height with an average roughness of 2 nm. (c) The load vs. displacement curves of Ti45Zr16Cu10Ni9Be20 MG under a maximum displacement 2.5 μm. Inset of Figure (c) is a schematic diagram of the arrays with 8 × 8 indentations.
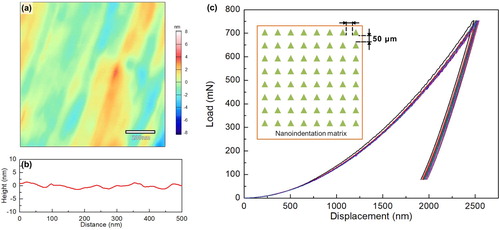
Figure 2. Cumulative distribution of strength (a) and modulus (b) corresponding to the load vs. displacement curves. (c) Distribution of strength for the stiff matrix (upper shaded area) and the soft regions (lower shaded area).
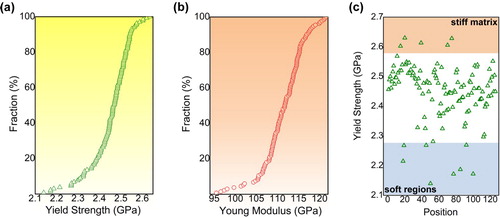
Figure 3. Polynomial function fitting (red solid lines) of the displacement-load curves for the stiff matrix (a) and the soft regions (b). Enlarged serration event-time curves at different stages: the incipient stage (a1) and the late stage (a2) of the stiff matrix; the incipient stage (b1) and the late stage (b2) of the soft regions.
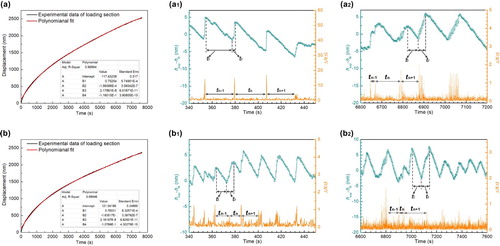
Figure 4. Cumulative probability distribution of strain burst size of different stages for (a) the stiff matrix and (b) the soft regions. The variation tendency of Sc with indentation load (shaded areas) can be clearly identified.
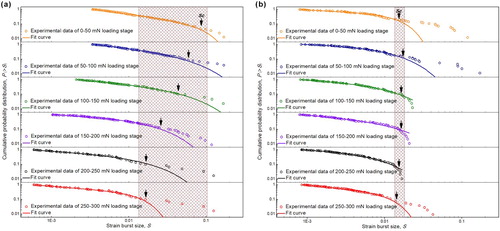
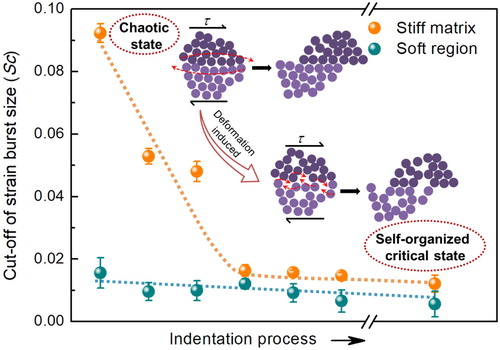
Figure 5. Evolution of the cut-off value of the strain burst size (Sc) as a function of different deformation stages for the stiff matrix and the soft regions. The insets are the schematic illustration of atomic activation for shear deformation. Shear band is triggered through long-range atomic cooperative operation in the chaotic state but only local diffusion and short-range atomic rearrangement are needed in the SOC state.