
Figures & data
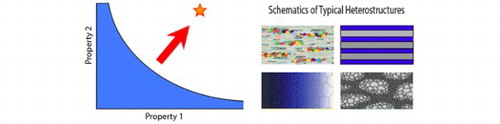
Figure 1. (a) Schematic diagrams of a GND pile-up from a Frank-Read dislocation source, inducing the back stress in the soft zone, which in turn induces the forward stress in the hard zone [Citation2]. (b) GND density gradient caused by the GND pile-up near the interface (zone boundary). (c) The strain and positive strain gradient caused by the GND pile-up near the interface (zone boundary).
![Figure 1. (a) Schematic diagrams of a GND pile-up from a Frank-Read dislocation source, inducing the back stress in the soft zone, which in turn induces the forward stress in the hard zone [Citation2]. (b) GND density gradient caused by the GND pile-up near the interface (zone boundary). (c) The strain and positive strain gradient caused by the GND pile-up near the interface (zone boundary).](/cms/asset/0264e1e4-ce33-46b9-ba6a-7b42ee78c200/tmrl_a_1796836_f0001_oc.jpg)
Figure 2. Evolution of the hetero-deformation induced (HDI) stress during tensile testing of gradient structured interstitial free (IF) steel [Citation15]. The slope of the curve represents HDI hardening rate.
![Figure 2. Evolution of the hetero-deformation induced (HDI) stress during tensile testing of gradient structured interstitial free (IF) steel [Citation15]. The slope of the curve represents HDI hardening rate.](/cms/asset/2b365090-1990-48d4-9fab-7c194ab00af8/tmrl_a_1796836_f0002_oc.jpg)
Figure 3. Unprecedented strengthening and extra strain-hardening in HL structured Ti [Citation3]: (a) HL structured Ti with recrystallized CG grains forming a soft lamellar that is surrounded by UFG matrix; (b) Outstanding tensile properties of HL structured Ti; (c) Engineering tensile stress-strain curves; (d) True strain hardening rates vs. true stress; (e) HDI hardening behaviors for HL structured Ti; (f) Dislocation pile-ups at hetero-interfaces in a CG grain.
![Figure 3. Unprecedented strengthening and extra strain-hardening in HL structured Ti [Citation3]: (a) HL structured Ti with recrystallized CG grains forming a soft lamellar that is surrounded by UFG matrix; (b) Outstanding tensile properties of HL structured Ti; (c) Engineering tensile stress-strain curves; (d) True strain hardening rates vs. true stress; (e) HDI hardening behaviors for HL structured Ti; (f) Dislocation pile-ups at hetero-interfaces in a CG grain.](/cms/asset/11833bd2-020d-455a-ba5f-181c693cc130/tmrl_a_1796836_f0003_oc.jpg)
Figure 4. Variation of microstructure and texture at varying depths from the surface of gradient-structured steel processed using a SPEX Mill [Citation118]. The percentage of grains indexed normal to the SMAT surface were calculated from EBSD maps and show the relative frequency of the {111} and {110} planes in ferrite at various depths. Pole figures are projected normal to the SMAT surface.
![Figure 4. Variation of microstructure and texture at varying depths from the surface of gradient-structured steel processed using a SPEX Mill [Citation118]. The percentage of grains indexed normal to the SMAT surface were calculated from EBSD maps and show the relative frequency of the {111} and {110} planes in ferrite at various depths. Pole figures are projected normal to the SMAT surface.](/cms/asset/985b7405-5124-42f8-807f-5db52d264e73/tmrl_a_1796836_f0004_oc.jpg)
Figure 5. (a) TEM image of the layered microstructure of a Cu/Nb nanolaminate. (b) microstructure after one hour at 500°C, (c) Stress-strain curves after exposure to elevated temperature [Citation132], (d) Tensile stress-strain behavior of Cu/Nb nanolaminate as a function of layer thickness [Citation126], and (e) Comparison in Hall-Petch behavior between measurement and prediction [Citation137].
![Figure 5. (a) TEM image of the layered microstructure of a Cu/Nb nanolaminate. (b) microstructure after one hour at 500°C, (c) Stress-strain curves after exposure to elevated temperature [Citation132], (d) Tensile stress-strain behavior of Cu/Nb nanolaminate as a function of layer thickness [Citation126], and (e) Comparison in Hall-Petch behavior between measurement and prediction [Citation137].](/cms/asset/982e9739-3263-44aa-a3be-9952bdc4a034/tmrl_a_1796836_f0005_oc.jpg)
Figure 6. 3D illustration of a harmonic structured material.
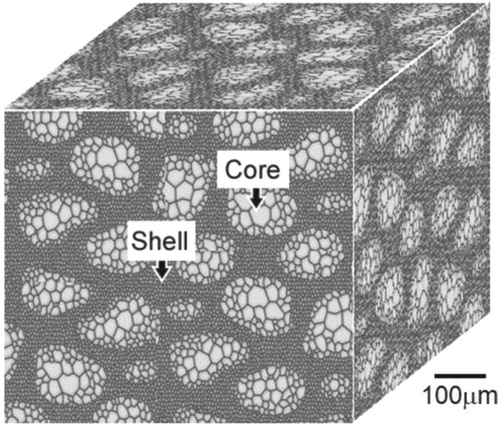
Figure 7. EBSD images of pure Ni compacts and their tensile stress-strain curves. (a) A homogeneous structured compact. (b) A partial harmonic structure from the mixture of the initial powder and a 360 ks milled powder. (c) A harmonic structure from 360 ks milled powder. (d) A harmonic structure from 540 ks milled powder.
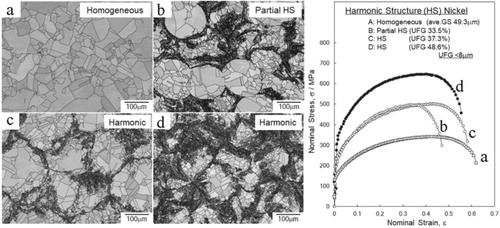
Figure 8. Schematics of DP microstructures of (a) hard island, (b) interpenetrating, and (c) soft island configurations.
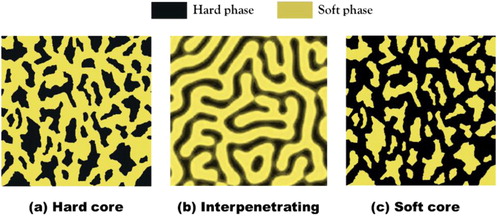
Figure 9. Multi-modal structured materials: (a) Tensile properties of bimodal structured 5083Al alloy [Citation170], (b) High-density dislocation distributed in the CG region [Citation174], (c) Cracks propagate through the NGs, but were blunted when they encounter ductile coarse grains, (d) Structure of trimodal 5083Al composite [Citation175], with (e) high strength of 1065 MPa and a tensile strain-to-failure value 4% [Citation172], and (f) B4C particles located at NG boundaries highlighted by black arrows [Citation177].
![Figure 9. Multi-modal structured materials: (a) Tensile properties of bimodal structured 5083Al alloy [Citation170], (b) High-density dislocation distributed in the CG region [Citation174], (c) Cracks propagate through the NGs, but were blunted when they encounter ductile coarse grains, (d) Structure of trimodal 5083Al composite [Citation175], with (e) high strength of 1065 MPa and a tensile strain-to-failure value 4% [Citation172], and (f) B4C particles located at NG boundaries highlighted by black arrows [Citation177].](/cms/asset/68861d1e-8b6a-4c19-ae58-f45270130182/tmrl_a_1796836_f0009_oc.jpg)
Figure 10. (a) SEM image of a dual-phase (DP) microstructure composed of soft ferrite (F) and hard martensite (M) in a low-carbon steel. (b) Stress-strain curves obtained by a tensile test at room temperature of the low-C steel having different microstructures, i.e. DP microstructure and mostly ferrite microstructure (with a small amount of pearlite) [Citation190] (Courtesy of Dr. Myeong-Heom Park of Kyoto University).
![Figure 10. (a) SEM image of a dual-phase (DP) microstructure composed of soft ferrite (F) and hard martensite (M) in a low-carbon steel. (b) Stress-strain curves obtained by a tensile test at room temperature of the low-C steel having different microstructures, i.e. DP microstructure and mostly ferrite microstructure (with a small amount of pearlite) [Citation190] (Courtesy of Dr. Myeong-Heom Park of Kyoto University).](/cms/asset/1ddc5fd6-05b8-4ec0-9164-9bbea7dfae93/tmrl_a_1796836_f0010_oc.jpg)
Figure 11. Mechanical properties of the uniform grain-sized pure NG and pure CG structures, and gradient structured (CG→NG and NG→CG) Ni at room temperature. (a) Uniaxial tensile properties of NG specimen show an increase in both yield strength and ultimate tensile strength compared to those in CG specimen. A good combination of strength and ductility can be achieved in the GS specimen as confirmed by the increase of plastic work density (or work of fracture), i.e. the area under the true stress-plastic strain curve, in the GS specimen from those in the CG and NG specimens. (b) R-curves for the four structures presented in terms of J-integral as a function of crack extension Δa. As the crack grows to Δa = 1 mm, the J-integral value of the CG specimen is increased to 442 kJ m−2, some six times higher that of the NG sample, 63 kJ m−2, showing evidence of ductile and brittle crack-growth behavior in the CG and NG structures, respectively. The R-curve of the gradient NG→CG materials shows an increasing slope, compared to that of the pure NG structure, as the crack grows into the gradient region, indicating an enhanced crack-growth toughness. The gradient CG→NG specimen presents a similar crack resistance to the CG specimen until crack extension ends in the initial part of the gradient zone, whereupon unstable crack growth occurs into the nano-grained region. A transition in the fracture mode from ductile to ‘brittle’ is apparent as the crack proceeds through the CG→NG gradient in this material [Citation69].
![Figure 11. Mechanical properties of the uniform grain-sized pure NG and pure CG structures, and gradient structured (CG→NG and NG→CG) Ni at room temperature. (a) Uniaxial tensile properties of NG specimen show an increase in both yield strength and ultimate tensile strength compared to those in CG specimen. A good combination of strength and ductility can be achieved in the GS specimen as confirmed by the increase of plastic work density (or work of fracture), i.e. the area under the true stress-plastic strain curve, in the GS specimen from those in the CG and NG specimens. (b) R-curves for the four structures presented in terms of J-integral as a function of crack extension Δa. As the crack grows to Δa = 1 mm, the J-integral value of the CG specimen is increased to 442 kJ m−2, some six times higher that of the NG sample, 63 kJ m−2, showing evidence of ductile and brittle crack-growth behavior in the CG and NG structures, respectively. The R-curve of the gradient NG→CG materials shows an increasing slope, compared to that of the pure NG structure, as the crack grows into the gradient region, indicating an enhanced crack-growth toughness. The gradient CG→NG specimen presents a similar crack resistance to the CG specimen until crack extension ends in the initial part of the gradient zone, whereupon unstable crack growth occurs into the nano-grained region. A transition in the fracture mode from ductile to ‘brittle’ is apparent as the crack proceeds through the CG→NG gradient in this material [Citation69].](/cms/asset/03be83a9-ba61-4a8f-a403-09a05a73f3f2/tmrl_a_1796836_f0011_oc.jpg)
Figure 12. (a) Schematic showing three regimes to describe the critical resolved shear stress in softer (A) layers needed to produce macroscopic yield in A/B multilayer thin films, as a function of individual layer thickness h. Adapted from[Citation35] and [Citation216].
![Figure 12. (a) Schematic showing three regimes to describe the critical resolved shear stress in softer (A) layers needed to produce macroscopic yield in A/B multilayer thin films, as a function of individual layer thickness h. Adapted from[Citation35] and [Citation216].](/cms/asset/62cc5aff-edc3-4241-9c8c-adc6ef237d74/tmrl_a_1796836_f0012_oc.jpg)
Figure 13. Experimental measurements of in-plane stress-plastic strain response in a sputtered epitaxial Cu-20 nm/Ni-20 nm multilayer thin film on a [Citation224] silicon substrate, for (a) Cu layers and (b) Ni layers. Adapted from Gram et al. [Citation43].
![Figure 13. Experimental measurements of in-plane stress-plastic strain response in a sputtered epitaxial Cu-20 nm/Ni-20 nm multilayer thin film on a [Citation224] silicon substrate, for (a) Cu layers and (b) Ni layers. Adapted from Gram et al. [Citation43].](/cms/asset/02f634d2-916e-4207-83ff-85b58c0dae32/tmrl_a_1796836_f0013_oc.jpg)
Figure 14. (a) Experimental tensile stress-plastic strain response of electrodeposited nanocrystalline Ni (30 nm); (b) Corresponding predictions from Quantized Crystal Plasticity (QCP) simulations using a wide grain-to-grain distribution of critical resolved shear stress ρ(τc) for slip (solid curves) versus a single τc (narrow distribution); (c) ρ(τc) distributions for ultrafine grain and nanocrystalline (30 nm) simulations. (a) is adapted from Cheng et al. [Citation225] and (b, c) are adapted from Li et al. [Citation11].
![Figure 14. (a) Experimental tensile stress-plastic strain response of electrodeposited nanocrystalline Ni (30 nm); (b) Corresponding predictions from Quantized Crystal Plasticity (QCP) simulations using a wide grain-to-grain distribution of critical resolved shear stress ρ(τc) for slip (solid curves) versus a single τc (narrow distribution); (c) ρ(τc) distributions for ultrafine grain and nanocrystalline (30 nm) simulations. (a) is adapted from Cheng et al. [Citation225] and (b, c) are adapted from Li et al. [Citation11].](/cms/asset/1abd25a2-b012-4828-8bfb-190978bd856d/tmrl_a_1796836_f0014_oc.jpg)
Figure 15. Distributions of (a) Plastic strain and tensile stress in the cross section at different strain levels from crystal plasticity modeling for uniaxial tension of gradient nanograined metals [Citation228].
![Figure 15. Distributions of (a) Plastic strain and tensile stress in the cross section at different strain levels from crystal plasticity modeling for uniaxial tension of gradient nanograined metals [Citation228].](/cms/asset/0fb814a9-e9ab-456c-9a97-8e1a5569b6c9/tmrl_a_1796836_f0015_oc.jpg)
Figure 16. Schematic composite model of symmetrical multiple slip in [001]-orientated fcc crystal. (a) deformation on intersecting symmetrical slip systems, leading to (b) the accumulation of pairs of interfacial GNDs bordering the vertical dislocation walls. (c) Back stress in the cell interior and forward stress in the cell walls [Citation232,Citation233].
![Figure 16. Schematic composite model of symmetrical multiple slip in [001]-orientated fcc crystal. (a) deformation on intersecting symmetrical slip systems, leading to (b) the accumulation of pairs of interfacial GNDs bordering the vertical dislocation walls. (c) Back stress in the cell interior and forward stress in the cell walls [Citation232,Citation233].](/cms/asset/b7fcb76e-da1d-400f-8c75-a8ef8d6a8cc5/tmrl_a_1796836_f0016_ob.jpg)
Figure 17. Schematics of typical trade-offs between conflicting properties [Citation243].
![Figure 17. Schematics of typical trade-offs between conflicting properties [Citation243].](/cms/asset/59b81e36-1ed0-48dc-a194-596ab8c90ffe/tmrl_a_1796836_f0017_oc.jpg)