Figures & data
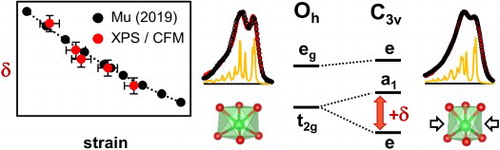
Figure 1. Evolution of the relative RHEED streak spacing and Cr 2p XPS spectra during the growth of α-Cr2O3(0001) under (a) compressive (α-Cr2O3 on α-Al2O3 substrate) and (b) tensile (α-Cr2O3 on α-Fe2O3 buffer) in-plane strain. The inset RHEED images were acquired with the 30 keV beam aligned along the azimuth. Examples of high-resolution Cr 2p core level spectra are depicted for α-Cr2O3 samples under high (c1) and moderate (c2) compressive strain as well as for a fully relaxed film (c3) and under high tensile strain (c4). A Shirley-type background subtraction was used for all spectra.
![Figure 1. Evolution of the relative RHEED streak spacing and Cr 2p XPS spectra during the growth of α-Cr2O3(0001) under (a) compressive (α-Cr2O3 on α-Al2O3 substrate) and (b) tensile (α-Cr2O3 on α-Fe2O3 buffer) in-plane strain. The inset RHEED images were acquired with the 30 keV beam aligned along the [11¯00] azimuth. Examples of high-resolution Cr 2p core level spectra are depicted for α-Cr2O3 samples under high (c1) and moderate (c2) compressive strain as well as for a fully relaxed film (c3) and under high tensile strain (c4). A Shirley-type background subtraction was used for all spectra.](/cms/asset/5a2ae289-393e-4a95-acb9-9a6da86ba780/tmrl_a_1863877_f0001_oc.jpg)
Figure 2. Calculated Cr 2p XPS spectra (red line) in comparison with the experimental spectra (black circles) for α-Cr2O3(0001) thin films under (a) high and (b) moderate compressive strain as well as (c) fully relaxed and (d) under in-plane tension. Below each spectrum, the calculated stick diagrams (FWHM = 0.1 eV) are shown. At the top right, the relative 3d orbital diagram are plotted for Dq = 0.208 eV, Dσ = 0.600 eV and Dτ = −0.295 ± 0.005 eV (a), −0.280 ± 0.005 eV (b), −0.270 ± 0.005 eV (c) and −0.260 ± 0.005 eV (d). At the top left, a schematic representation of the CrO6 distortion are depicted.
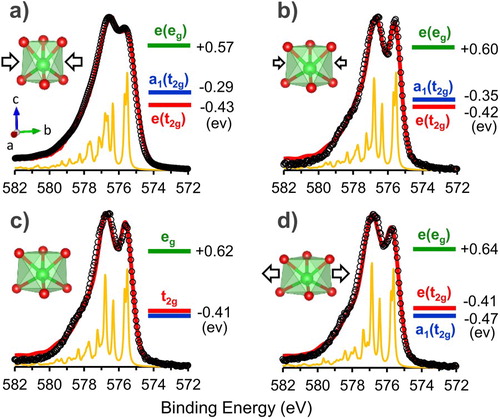
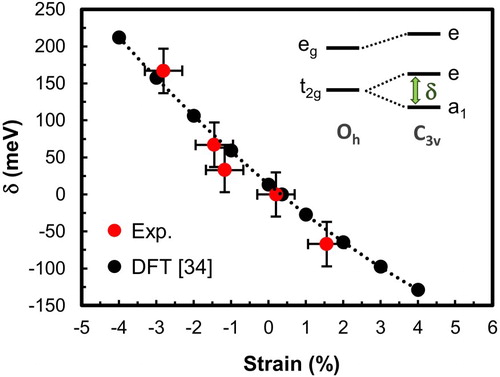
Figure 3. Evolution of the t2g level splitting δ with epitaxial strain. The positive or negative sign of the δ parameter indicates that a1 orbital is above or below e orbital, respectively. In inset, a schema of the 3d energy level for octahedral and trigonal symmetry highlighting the value of the δ parameter.