Figures & data
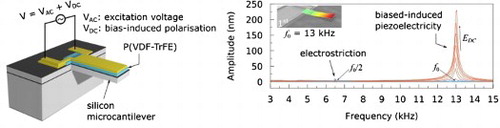
Figure 1. Thin film characteristics of P(VDF-TrFE). (a) AFM images showing the height profile of the ferroelectric polymer P(VDF-TrFE) for a non-annealed and annealed sample at 140°C, respectively. (b) Specular XRD measurements of P(VDF-TrFE) confirming the presence of the polar β-phase conformation that renders its ferroelectric properties. The crystallinity raises significantly after the annealing at 140°C. (c) Bistable hysteresis loops of the polarisation as a function of the applied field, revealing the ferroelectric characteristic of the P(VDF-TrFE) thin films synthesised within this work. Additionally, the non-linear longitudinal electrostrain behaviour of the polymer is shown. All measurements have been performed in air at room temperature. The polymer film had a thickness of 500 nm.
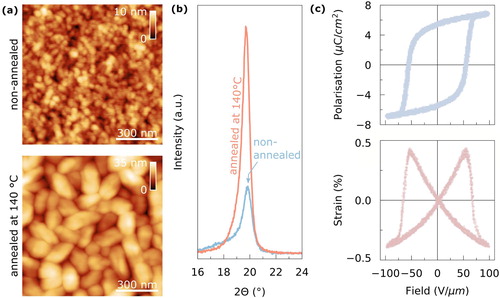
Figure 2. Ferroelectric polymer microcantilever. (a) SEM image showing a ferroelectric polymer microcantilever investigated in this work. (b) Schematic illustration of the multimorph structure of the microcantilever. The cantilever has a length of 400 µm, a width of 200 µm and a total thickness of around 3 µm. Details about the fabrication steps are presented in the supplementary material. (c) SEM image showing the multimorph structure of the microcantilever, proving that the polymer film has a thickness of 500 nm. (d) Bistable polarisation-field hysteresis loops of the P(VDF-TrFE) thin film incorporated on the silicon microcantilever confirming the ferroelectric state of the polymer. (e) Frequency spectrum of the ferroelectric polymer microcantilever when applying an excitation field of 1 V/µm. A large variety of flexural modes is excited in the cantilever as shown in the inset.
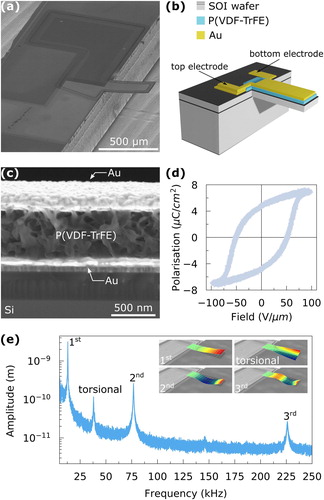
Table 1. Comparison of key parameters, such as resonance frequency or
-factor, of piezoelectric actuated microcantilevers using P(VDF-TrFE) or AlN. The Q-factors of P(VDF-TrFE) cantilevers are significantly lower compared to AlN cantilevers. The resonance frequency
and
-factor were all measured in air.
Figure 3. Electrostrictive and piezoelectric response of the first flexural mode. (a) Amplitude of the first and second harmonic signal as a function of increasing excitation field amplitude EAC measured around the mechanical resonance frequency f0 = 13 kHz and f0/2. (b) Amplitude of the first and second harmonic signal measured over the frequency range from 3 kHz to 15 kHz, which includes f0 and f0/2. The electrostrictive and piezoelectric response are clearly separated. (c), (d) Maximum amplitude of the first and second harmonic resonance peak as a function of the excitation field amplitude EAC. The piezoelectric effect is linear, while the electrostrictive effect shows a quadratic behaviour.
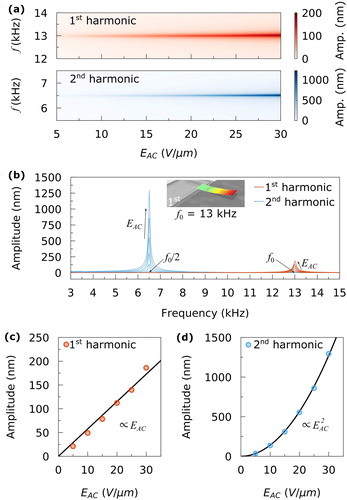
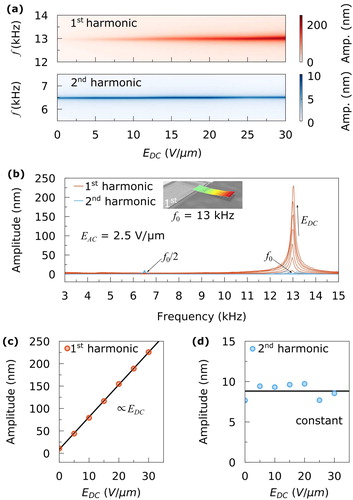
Figure 4. Electrostrictive and piezoelectric response of the first flexural mode as a function of bias field applied to the ferroelectric polymer. An AC field of 2.5 V/µm was used to excite the microcantilever. (a) Amplitude of the first and second harmonic signal as a function of increasing bias field EDC measured around the mechanical resonance frequency f0 = 13 kHz and f0/2. (b) Amplitude of the first and second harmonic signal measured over the frequency range from 3 kHz to 15 kHz, which includes f0 and f0/2, showing the significant contrast between the electrostrictive and piezoelectric response as a function of the applied bias field EDC. (c),(d) Maximum amplitude of the first and second harmonic resonance peak as a function of the bias field EDC. The piezoelectric response increases linearly with increasing EDC. In contrast, an increased EDC shows no impact on the electrostrictive response.