
Figures & data

Figure 1. MD simulations: (a) Simulation cell, (b) Example of a migration event observed at 0.2 GPa and
300 K, (c) Average nucleation times at
0.2 and 0.4 GPa as a function of temperature. The crystallographic basis in (a) refers to the crystal in the lower half of the cell.
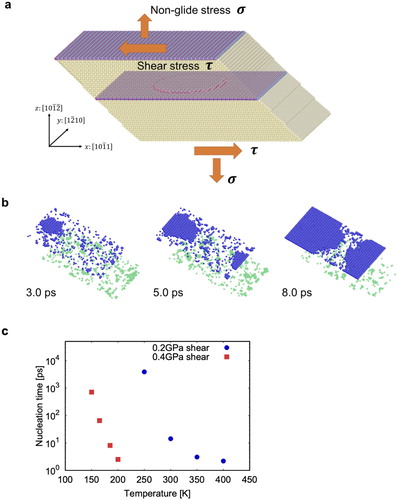
Figure 2. FENEB calculations: (a) Example of a minimum energy path computed at GPa, (b) stress-dependence of the activation energy. The inset in (b) shows the activation surface, computed either from the stress derivative of the activation energy (blue circles) or by counting the number of atoms in the activated island (red circles).
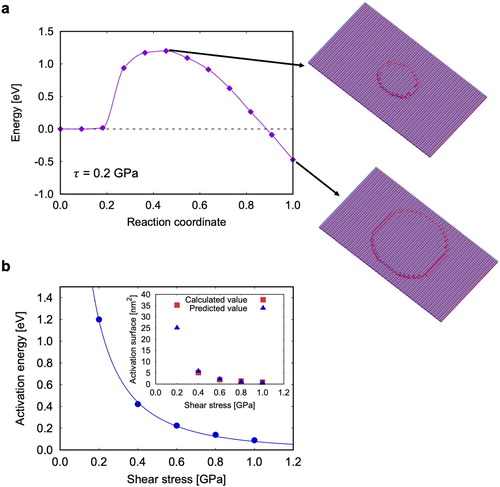
Figure 3. Non-glide effects: (a) Example of energy path under the combined effect of a 0.4 GPa shear stress and ± 0.2 GPa tensile stresses, (b,c) Tensile stress dependence of the activation energy at (b) 0.2 and (c) 0.4 GPa.
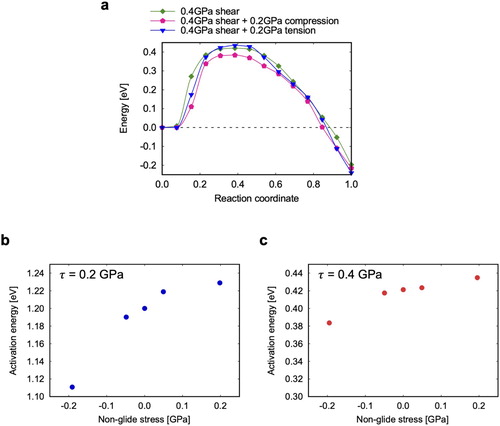
Figure 4. PAFI calculations at 0.2 and 0.4 GPa: (a,b) Free energy pathways at different temperatures, (c,d) Activation free energy
as a function of temperature, (e,f) Comparison between predicted and measured nucleation times, (g,h) Activation entropy
, (i-j)Activation internal energy,
.

Data availability
The data supporting the findings of this work are available from the corresponding author on reasonable request.