Figures & data
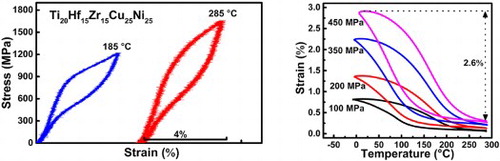
Figure 1. Backscattered electron images taken in the planes (a) perpendicular to and (b) parallel to the solidification direction (SD) of the button ingot. (c) EDS maps of the elements Ti, Hf, Zr, Cu and Ni, taken from the area the backscattered electron image of which is shown in the upper left panel.
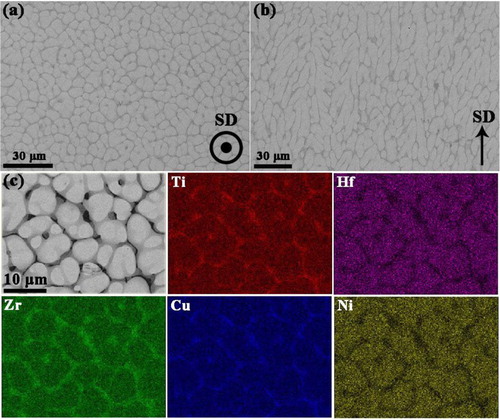
Table 1. Average chemical compositions (at.%) of the dendritic and interdendritic regions for the Ti20Hf15Zr15Cu25Ni25 alloy.
Figure 2. (a) X-ray diffraction patterns measured at 200°C and −100°C. The letters ‘A’ and ‘M’ in the indices denote austenite and martensite, respectively. (b) DSC curve recorded with a heating and cooling rate of 10°C/min.
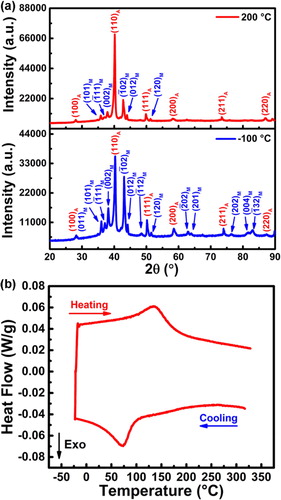
Figure 3. Stress-strain curves recorded at different constant temperatures ranging from 185°C to 285°C.
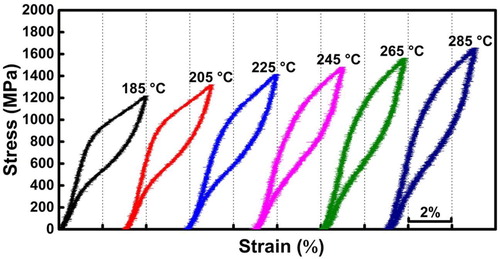
Figure 4. (a) Bright-field TEM image. (b) Selected area electron diffraction pattern taken from the area enclosed by the circle in (a), which is from the dendritic region. The subscripts ‘A’, ‘M’ and ‘T’ in the indices denote austenite, martensite and twin, respectively. (c) High-resolution TEM image taken from an area with coexisting austenite (A) and martensite (M). The A and M regions were identified from the corresponding fast Fourier transform patterns (not shown) of these regions. (d) Inverse fast Fourier transform image for the area enclosed by the rectangle in (c).
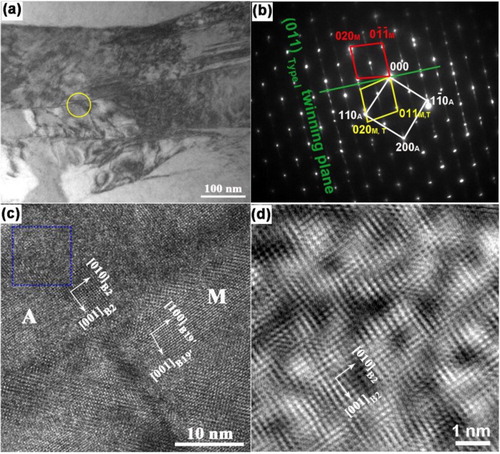
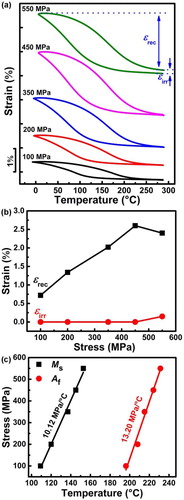
Figure 5. (a) Strain-temperature curves measured with the three-point bending mode during load-biased thermal cycling under different stresses. The determination of the recoverable strain εrec and irrecoverable strain εirr is illustrated. (b) εrec and εirr plotted as a function of stress. (c) Stress dependence of Ms and Af.