Figures & data

Figure 1. Stacking structure in the box (a), microstructures of monolithic steel (b and c) and composite steel (d–g). Martensite steel (b) and Hadfield steel (c), optical observation on composite steel (d), and TEM microstructure of the martensite layer (e), interface region (f), and Hadfield layer in accordance with the square regions marked A, B, and C in d.
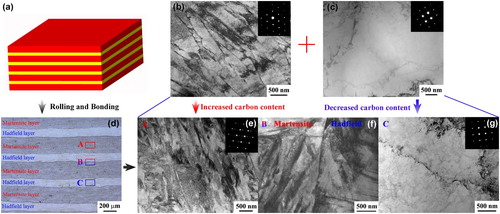
Figure 2. EMPA results on the content of alloying elements between neighbor layers (a and c) and calculated carbon activity using Thermal Calc software (b).
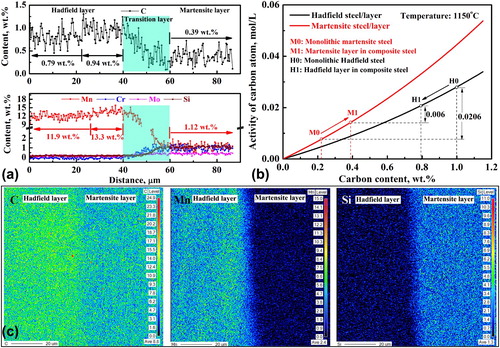
Figure 3. Engineering stress–strain curves (a) and the corresponding strain-hardening rate–strain curves (b) of composite steel and the reference monolithic steel. Note: UD, TD, UTS, and YS indicate uniform ductility, total ductility, ultimate tensile strength, and yield strength, respectively.
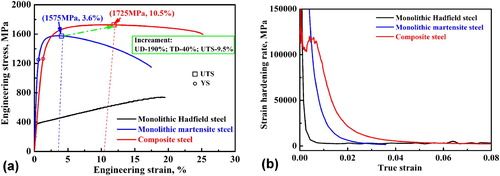
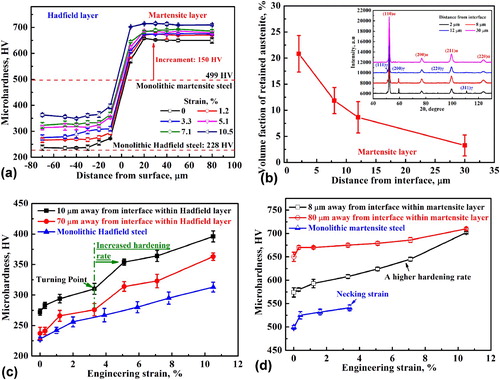
Figure 4. Hardness evolution in composite steel and its comparison with monolithic steel (a, c, and d) and the volume fraction of retained austenite in the martensite layer (b).