
Figures & data
Figure 1. Characteristics of ultralow-temperature superplasticity in the UFG Al–Zn–Mg–Zr alloy: (a) UFG structure having an average grain size of ∼200 nm, (b) Stress–strain (σ–ε) curves, showing a total elongation higher than 500% at 170°C (0.47 homologous temperature) and (c) Significance of the present study indicated by reviewing the temperature dependence of superplasticity of commercial Al alloys of 7000 (AlZnMg-based) system [Citation5,Citation15–24] and other(AlMg-, AlLi-based) systems [Citation1,Citation7,Citation15,Citation25–30].
![Figure 1. Characteristics of ultralow-temperature superplasticity in the UFG Al–Zn–Mg–Zr alloy: (a) UFG structure having an average grain size of ∼200 nm, (b) Stress–strain (σ–ε) curves, showing a total elongation higher than 500% at 170°C (0.47 homologous temperature) and (c) Significance of the present study indicated by reviewing the temperature dependence of superplasticity of commercial Al alloys of 7000 (AlZnMg-based) system [Citation5,Citation15–24] and other(AlMg-, AlLi-based) systems [Citation1,Citation7,Citation15,Citation25–30].](/cms/asset/9a49fa1a-3b2a-4537-a839-a8ef6edf1b26/tmrl_a_1976293_f0001_oc.jpg)
Figure 2. Determination of the activation energy (Q) of ultralow-temperature superplasticity in the UFG Al–Zn–Mg–Zr alloy.
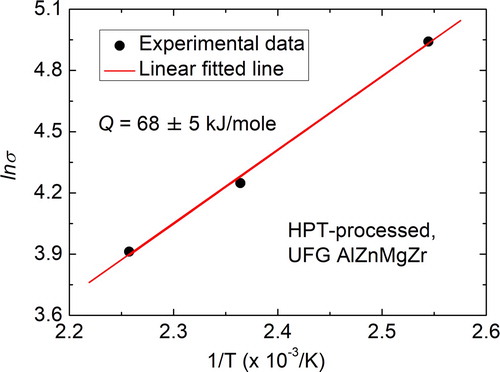
Figure 3. Microstructure of the sample superplastically deformed at 170°C and a strain rate of 5 × 10⁻⁴ s−1 (a) Low magnification STEM-HAADF image showing the existence of Zn-containing particles (bright ones) and Zn-rich Al/Al grain boundaries (indicated by the green arrows), (b) High magnification HAADF image showing Zn-rich grain boundaries (forming a brightly imaged triple junction). (c–e) corresponding EDS maps for Al, Mg and Zn, respectively. (f) EDS line profile analysis along a boundary, marked by arrows in the HAADF image, showing the segregation of Zn and Mg atoms into Al/Al grain boundaries in the HPT-processed UFG sample.
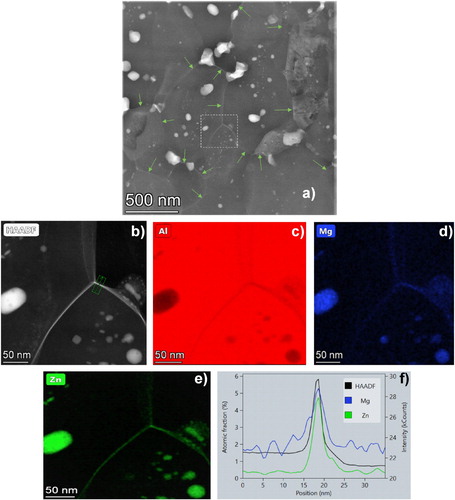
Figure 4. Trapping effect of sliding grain boundary. (a) Calculated hydrostatic stress component (p) around a slipped grain boundary (the arrows show the direction of the diffusion currents). (b) Accumulation points for solute atoms smaller (red) and larger (blue) than the matrix atoms (Al). The green dashed lines represent the grain boundaries.
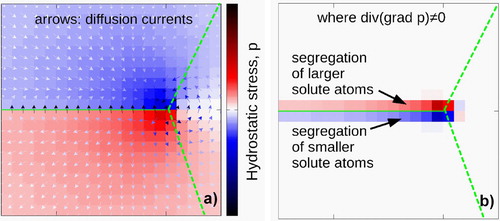
Figure 5. The room temperature Vickers hardness (HV) of the samples after superplastic deformation at 120°C (blue dashed line) and 170°C (red dashed line), as well as the peak hardness obtained for the initial coarse-grained sample after the conventional T6 treatment (black dashed line). The hardness values of the HPT-processed UFG samples statically annealed for different times at 120°C (blue solid square) and 170°C (red solid circle) are also plotted to show the thermal stability of this sample.

Supplemental Material
Download MS Word (34.2 KB)Data availability
The data that support the findings of this study are all own results of the authors, not available anywhere.