
Figures & data

Figure 1. Description of as-deposited Ti67 alloy: (a) schematic of the deposition process, (b) phase structure, (c) etched surface of the oxidation specimen, (d) microstructure of non-HAB region, (e) microstructure of HAB, and (f) EPMA mapping of c.
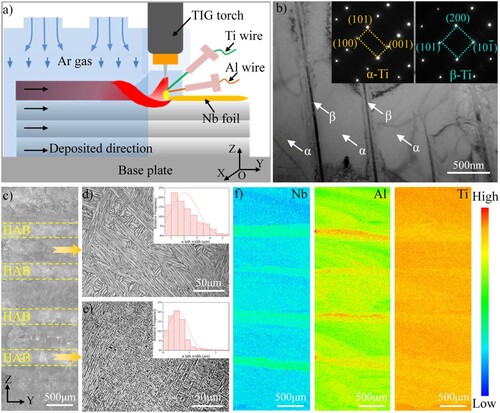
Figure 2. Characterization of oxide scales on specimens oxidized at 800°C for different times: (a) photograph of the surface shown in Figure c after being oxidized for 24 h, (b-d) surface morphologies of HAB oxidized for 0.5 h, 6 h and 24 h, respectively, (e-g) surface morphologies of non-HAB zone oxidized for 0.5, 6, and 24 h, respectively, (h) XRD spectra of the original Ti67 alloy and the specimens oxidized for different times, and (i) oxidation kinetics of HAB and non-HAB zone.
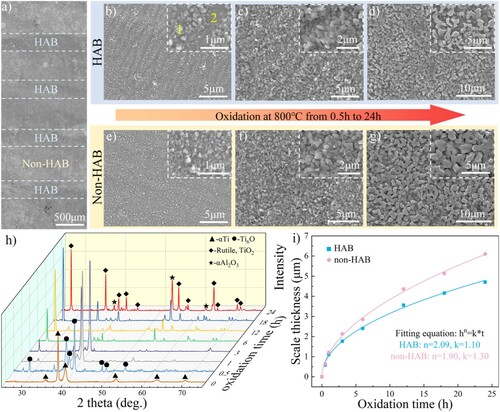
Table 1. The average particle size of the oxide at various oxidation times (unit: nm).
Table 2. EDS analysis of the points in Figure (at. %).
Figure 3. TEM analysis of Ti67 alloy after oxidation for 24h: (a) TEM image of the oxide scale and matrix on HAB; (b) TEM image of the oxide scale on non-HAB zone; (c,d) EDS elemental mappings for the selected area in a and b and (e-h) SAED patterns of different phases.
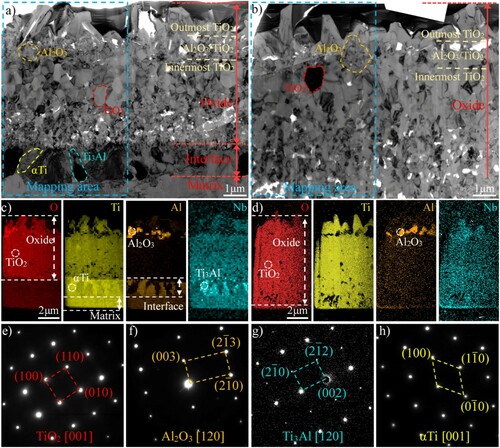
Figure 4. The influencing mechanism of original microstructure on oxidation resistance: (a) TEM image of the oxide scale/matrix interface on non-HAB zone after oxidation at 800°C for 24h6, (b) EDS elemental mappings for a, (c) original microstructure of HAB, (d) original microstructure of non-HAB zone and (e) schematic diagrams illustrating the Ti3Al precipitation process on HAB and non-HAB zone.
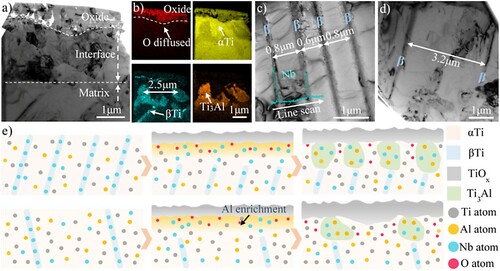
Table 3. Elemental content of Ti3Al and αTi adjacent with oxide scale in Figure (at. %).