Figures & data
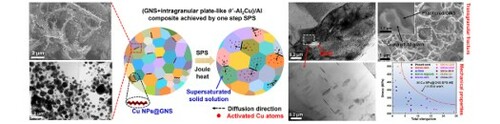
Figure 1. (a–c) TEM images of Al–Cu NPs@GNS-SPS-HE composite; bright-field STEM images (d and f), the corresponding EDS line scan spectra of Al and Cu elements (e and g); (h and i) HRTEM characterization of -Al2Cu and interface; (k) Schematic diagram of the microstructure of Al–Cu NPs@GNS-SPS-HE sample.
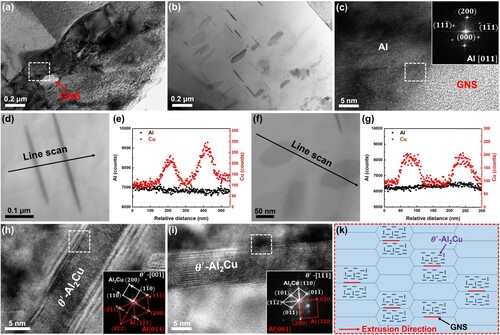
Figure 2. (a–c) TEM images and (d) schematic diagram of the microstructure of Al–Cu NPs@GNS-CPS-HE composite; (e–g) the microstructure of solution and ageing Al–Cu NPs@GNS-CPS-HE composite.
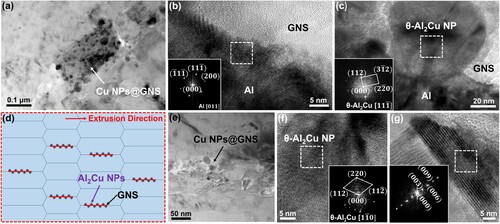
Figure 3. The schematic of reaction processes in Al–Cu NPs@GNS-SPS-HE and Al–Cu NPs@GNS-CPS-HE composites during sintering.
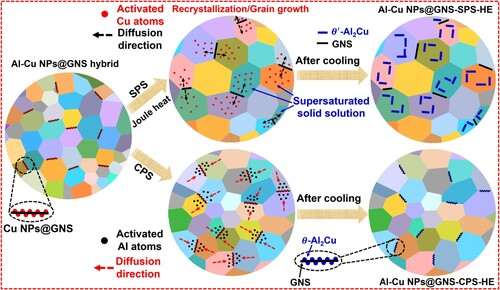
Figure 4. EBSD inverse pole figures of (a) Al–Cu NPs@GNS-SPS-HE and (b) Al–Cu NPs@GNS-CPS-HE composites; (c) the engineering stress-strain curves, (d) the true stress-true strain curves, (e) the strain hardening rate curves and (f) strength and ductility of Al–Cu NPs@GNS-SPS-HE composite prepared in this work compared with AMCs reinforced with graphene and other alloy-based composites reported in previous studies.
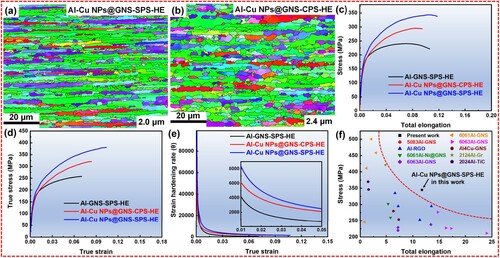
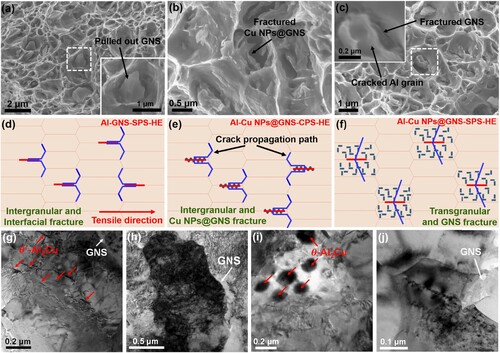
Figure 5. SEM images of fracture surface for (a) Al-GNS-SPS-HE, (b) Al–Cu NPs@GNS-CPS-HE and (c) Al–Cu NPs@GNS-SPS-HE; diagrammatic drawing of fracture process for (d) Al-GNS-SPS-HE, (e) Al–Cu NPs@GNS-CPS-HE and (f) Al–Cu NPs@GNS-SPS-HE composites. TEM images of (g–h) Al–Cu NPs@GNS-SPS-HE and (i and j) Al–Cu NPs@GNS-CPS-HE composites after tensile test.