Figures & data
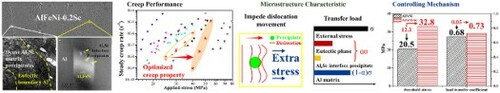
Figure 1. Microstructure characteristics: (a) AlFeNi; (b) AlFeNi-0.2Sc. (c) Sc concentration in different areas. Al3Sc distribution in different zones of the AlFeNi-0.2Sc alloy at peak-aged state: (d) Eutectic boundary Al; (e) Eutectic internal Al.
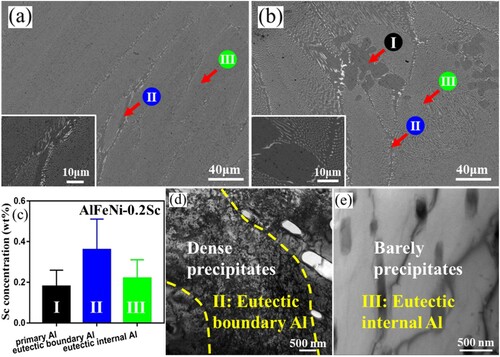
Figure 2. (a, c) Eutectic phase inside grains of the AlFeNi-0.2Sc alloy at peak-aged state; (b) Element distributions around the eutectic phase; (d) Overall morphology of the precipitate at Position A near the Al/Al9FeNi interface; (e) HRTEM image at Position A.
Table 1. Element contents (at%) of featured points at the eutectic phase and surrounding area of AlFeNi-0.2Sc alloy at peak-aged state.
Figure 3. (a) Al/Al9FeNi interface and crystalline orientation of each phase under this axis; (b) Lattice structure of Al9FeNi under the [00] axis; (c) Schematic diagram of OR1; (d) Lattice structure of (11
)Al; (e) Lattice structure of (00
)Al9FeNi; (f) Interface structure from the side view; (g) Schematic diagram of Sc precipitation in the interface structure.
![Figure 3. (a) Al/Al9FeNi interface and crystalline orientation of each phase under this axis; (b) Lattice structure of Al9FeNi under the [01¯0] axis; (c) Schematic diagram of OR1; (d) Lattice structure of (111¯)Al; (e) Lattice structure of (001¯)Al9FeNi; (f) Interface structure from the side view; (g) Schematic diagram of Sc precipitation in the interface structure.](/cms/asset/46541618-1360-434c-9d1f-9a8f5520e801/tmrl_a_2136016_f0003_oc.jpg)
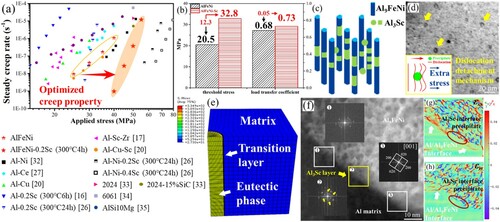
Figure 4. (a) Comparison of the creep behavior of Al alloys at 300°C; (b) Comparison of the dislocation creep behavior of AlFeNi alloy at 300°C; (c) Schematic diagram of Al3Sc precipitates under peak aging; (d) Interaction between dislocation and matrix precipitates; (e) FEM Simulation of stress distribution after the formation of transition layer around the eutectic phase; (f) Al3Sc precipitate layer around the eutectic phase and the lattice strain around the interface calculated by GPA: (g) Vertical interface; (h) Along interface (The white arrow points at the Al/Al9FeNi interface; the red circle marks the Al3Sc interface precipitate).