Figures & data

Figure 1. Typical microstructures of trimodal CNT/2024Al composites (sample with 20% FG and made of 33 µm pure Al powders): (a) IPF map showing the trimodal grain structures, (b) dark-field TEM image of Modal 1 UFG and 2 FG domains, (c) the statistical grain size distribution, (d) bright-field TEM image showing CNTs located in grain boundaries, (e) EDX maps of the marked orange dashed line region in (d), (f) HRTEM image of the marked black box in (d) showing the interfacial structure.
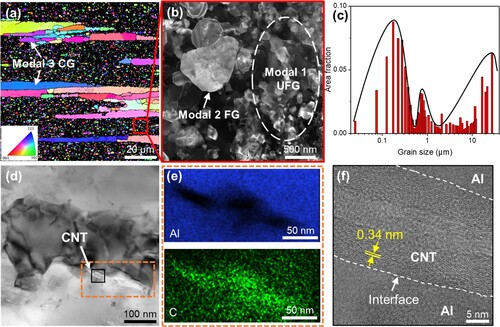
Figure 2. IPF maps of trimodal CNT/2024Al composites with different CG bands showing the CG structures in the longitudinal direction (a–c) and the transverse direction (d–f): (a, d) narrow CG, (b, e) medium CG, (c, f) wide CG. (g–l) The corresponding size distributions of the length and width of the different CG bands.
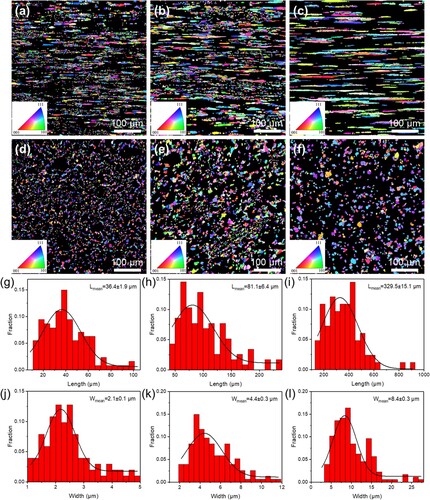
Figure 3. (a) Engineering stress-strain curves, (b) a comparison of the mechanical properties of the current trimodal CNT/2024Al with previous references, (c) strain hardening rate vs. true strain curves of trimodal CNT/2024Al composites with different CG bands, (d) FWHM as a function of the diffraction angle (2θ) before deformation and at 3% strain.
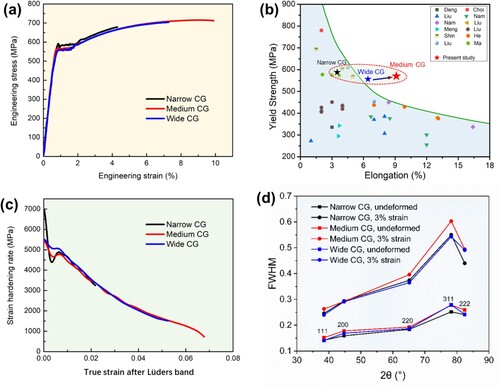
Table 1. Tensile properties of trimodal CNT/2024Al composites with different grain structures.
Table 2. Dislocation density of the trimodal CNT/2024Al with different CG size before and after deformation.
Figure 4. (a–c) IPF and (d-f) GNDs maps of the trimodal CNT/Al-Cu-Mg composites with different CG bands at 3% tensile strain: (a, d) narrow CG, (b, e) medium CG, (c, f) wide CG. TEM images of 20% FG trimodal CNT/2024Al composites with wide CG at 3% tensile strain showing the dislocation pile-ups in the (g) FG and (i) CG. (h) the IAZ width is the distance from the starting point f′ to the point f″ where the orientation does not change significantly.
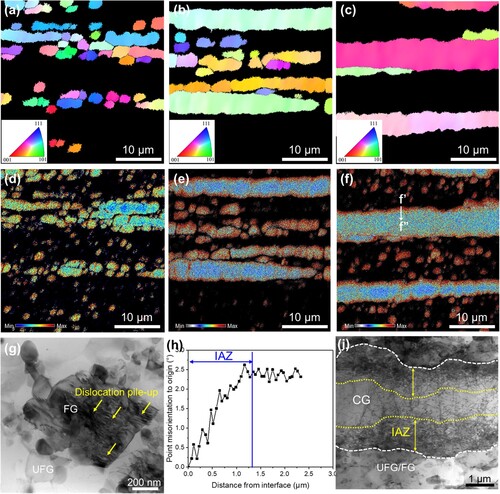
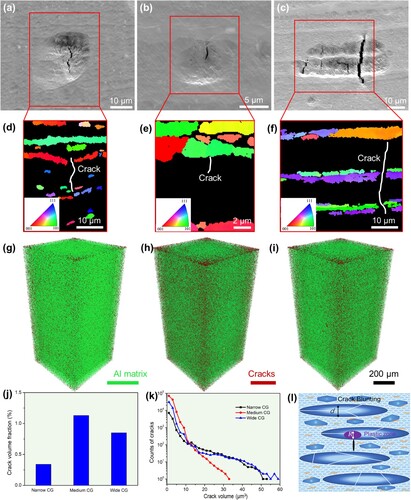
Figure 5. (a–c) SEM images and (d-f) IPF of cracks in trimodal CNT/2024Al composites at 3% tensile strain: (a, d) narrow CG, (b, e) medium CG, (c, f) wide CG. 3D distributions of cracks in trimodal CNT/2024Al composites after fracture: (g) narrow CG, (h) medium CG, (i) wide CG; (j) volume fraction and (k) size distribution of cracks in trimodal CNT/2024Al composites after fracture. (l) A schematic illustration of trimodal grain structure model with different CG sizes.