
Figures & data
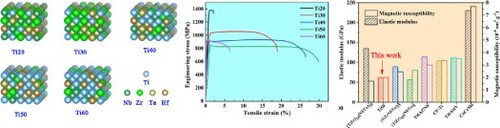
Figure 1. (a) XRD patterns of TiNbZrTaHf alloys with different Ti contents; Inverse pole figures from EBSD of Ti20 (b), Ti30 (c), Ti40 (d), Ti50 (e) and Ti60 (f), and the corresponding local misorientation maps (g-k); (l) HAADF image and (m-q) corresponding STEM-EDX elemental distribution maps from Ti30 alloy after recrystallisation annealing at 1073 K, inset in (l) is corresponding SAED pattern along [110] direction.
![Figure 1. (a) XRD patterns of TiNbZrTaHf alloys with different Ti contents; Inverse pole figures from EBSD of Ti20 (b), Ti30 (c), Ti40 (d), Ti50 (e) and Ti60 (f), and the corresponding local misorientation maps (g-k); (l) HAADF image and (m-q) corresponding STEM-EDX elemental distribution maps from Ti30 alloy after recrystallisation annealing at 1073 K, inset in (l) is corresponding SAED pattern along [110] direction.](/cms/asset/6f432c9d-b271-40b5-a7e7-87b73c606bd6/tmrl_a_2197942_f0001_oc.jpg)
Figure 2. (a) Tensile stress–strain curves of the TiNbZrTaHf based alloys with different Ti contents; (b) comparison of the developed Ti-rich TiNbZrTaHf concentrated alloys with conventional TNZT alloys [Citation4,Citation5,Citation23–35] and BCC refractory HEAs [Citation12,Citation13,Citation36–41]; (c) magnetization variation as a function of applied magnetic field at room temperature; (d) comparison of magnetic susceptibilities and Young's elastic modulus of alloys Ti50 with some BCC HEAs, titanium alloys and alloys commonly used in medical devices [Citation12,Citation45,Citation46].
![Figure 2. (a) Tensile stress–strain curves of the TiNbZrTaHf based alloys with different Ti contents; (b) comparison of the developed Ti-rich TiNbZrTaHf concentrated alloys with conventional TNZT alloys [Citation4,Citation5,Citation23–35] and BCC refractory HEAs [Citation12,Citation13,Citation36–41]; (c) magnetization variation as a function of applied magnetic field at room temperature; (d) comparison of magnetic susceptibilities and Young's elastic modulus of alloys Ti50 with some BCC HEAs, titanium alloys and alloys commonly used in medical devices [Citation12,Citation45,Citation46].](/cms/asset/391eb46a-7f5a-41bb-ac12-be2a9869868a/tmrl_a_2197942_f0002_oc.jpg)
Figure 3. Evolution of the microstructure of Ti50 sample during deformation; (a) microstructure of sample with 6% tensile strain, a-1 and a-2 is the surface morphology from the different region of sample, respectively, a-3 and a-4 is the SEM image and corresponding EBSD of microcrack; (b) microstructure of sample with 24% tensile strain, b1-b3 present necking and cracking of sample, b4 shows wavy deformation bands; (c) microstructure of sample after fracture, c-1 is the surface morphology of the sample near the crack, c-2 shows the detail of deformation bands, c-3 indicates fractorgraphy; (d) schematic illustration showing the change in dislocation structures during deformation.
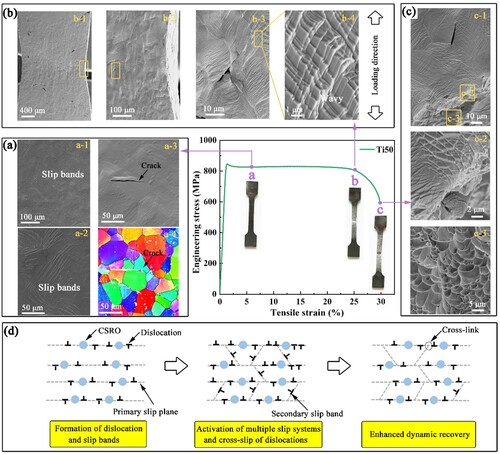
Figure 4. (a) Unstable stacking fault energy (γusf) and surface energy (γsurf) of TiNbZrTaHf based alloys predicted from DFT calculations. The above and below inset is the supercell for calculations of surface energies and unstable stacking fault energy, respectively. These figures show a projection along the [−112] direction; (b) evolution of γsurf/γusf in TiNbZrTaHf based alloys with different Ti contents; (c) schematic of crack evolution during deformation, showing extension of cracking under loading, and sharp crack is blunted crack by the dislocation emission.
![Figure 4. (a) Unstable stacking fault energy (γusf) and surface energy (γsurf) of TiNbZrTaHf based alloys predicted from DFT calculations. The above and below inset is the supercell for calculations of surface energies and unstable stacking fault energy, respectively. These figures show a projection along the [−112] direction; (b) evolution of γsurf/γusf in TiNbZrTaHf based alloys with different Ti contents; (c) schematic of crack evolution during deformation, showing extension of cracking under loading, and sharp crack is blunted crack by the dislocation emission.](/cms/asset/c1bbbf49-fb8c-42ac-b46a-17e801a2848c/tmrl_a_2197942_f0004_oc.jpg)
Supplemental Material
Download MS Word (2.9 MB)Data availability statement
The data that support the findings of this study are available from the corresponding author upon reasonable request.