Figures & data
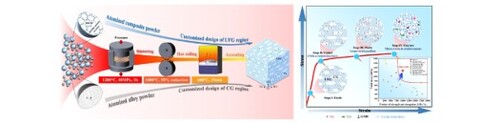
Figure 1. Schematic of the customized strategy to develop the heterostructured titanium matrix composites (TMCs).
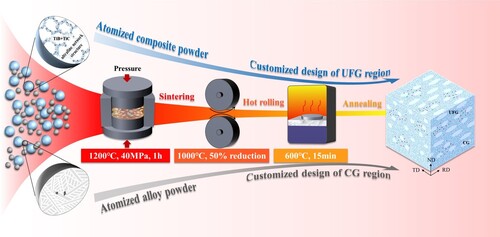
Figure 2. (a) Tensile engineering stress-strain curves of the Ti6Al4V and the heterostructured TMC, (b) True stress-strain curves and strain hardening rate versus true strain curves, (c) LUR stress-strain curves and the corresponding back stress-strain curves, (d) A comparison of the YS and the product of UTS and elongation of the rolled heterostructured TMC with other as-rolled TMCs.
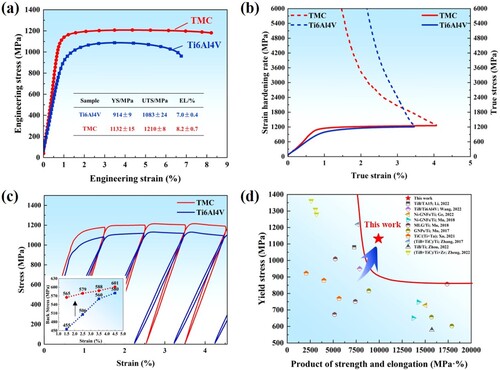
Figure 3. Microstructures of the heterostructured TMC. (a) IPF map, (b) TEM micrographs for the bimodal grains, (c) Pole figures, (d) Grain map, (e) Grain boundary distribution map, (f) KAM map, (g) Grain size distributions, (h) Misorientation angle distribution (MAD), (i) SFs of slips corresponding to basal <a>, prismatic <a> and pyramidal<c+a>, respectively.
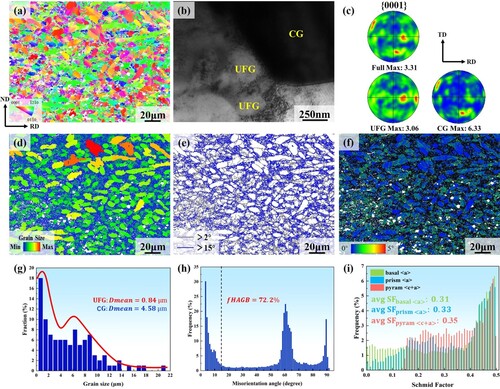
Figure 4. SEM images of the heterostructured TMC at different deformation stages of (a) ϵ = 3%, (b) ϵ = 6%, (c) Fracture, (d∼f) TEM images in two-beam condition with g = 011 or g = 0002 of the rolled TMCs after tensile tests. (d) In CGs, (e) Region nearby the TiB, (f) Region nearby the TiC.
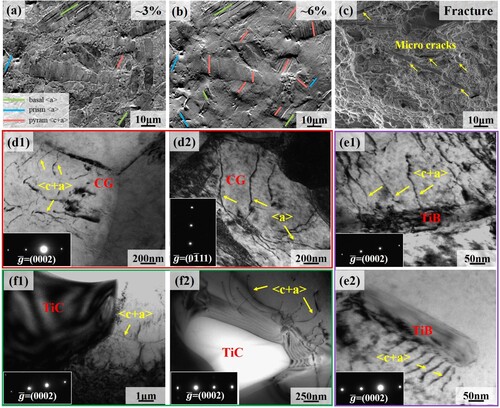
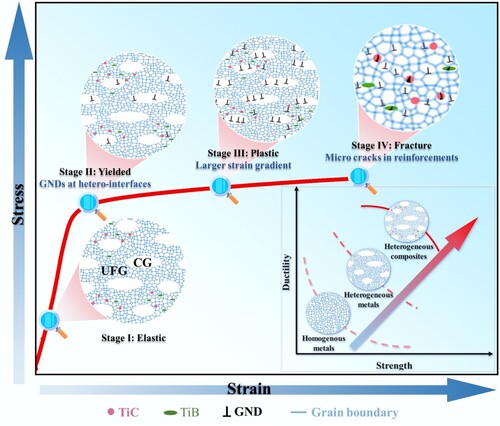
Figure 5. Schematic illustration of the deformation mechanism.