
Figures & data
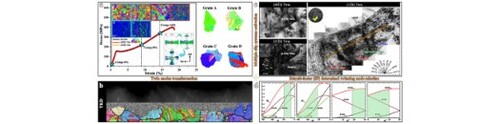
Figure 1. Typical compressive stress-strain curve of the as-extruded Mg-Al-Gd alloy. IPF maps, KAM maps (overlaid with special boundaries by red and orange-yellow lines) and pole figures of the as-extruded alloy with various compression strains: (a, d and g) 0%, (b, e and h) ∼8% and (c, f and i) ∼14%.
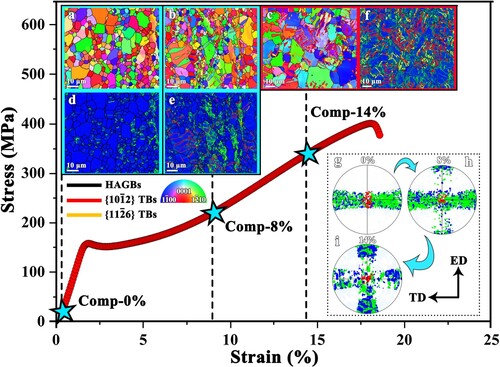
Figure 2. Typical EBSD result of the as-extruded Mg-Al-Gd alloy compressed by ∼14%: (a) IPF map. (b) Corresponding grain boundary map. (c) Enlarged IPF maps for grains A, B, C, and D with corresponding PFs. (d) Misorientation angle distribution maps corresponding to (a) and (e) Pole figures corresponding to (a): (red),
(green) and
(blue).
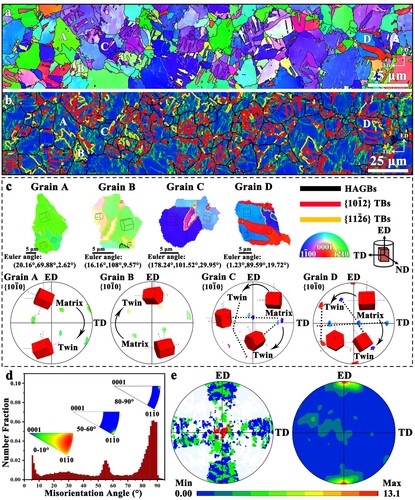
Figure 3. TEM and TKD results of two types of twins in the Mg-Al-Gd alloy compressed by ∼14%: (a) TKD orientation map with special boundary misorientation angles: ∼86° (red) and ∼56° (orange-yellow). (b) SEM image corresponding to (a). (c, d) Enlarged images corresponding to the rectangle in (a, b). (e) BF-TEM image of the twin. (f) HRTEM image showing the
TB. (g) BF-TEM image of the
twin. (h) BF-TEM image corresponding to the rectangle in (g). (i) The SAED pattern from both the matrix and
twin. (j) Schematic diagram of the SEAD pattern in (i). (k) HRTEM image showing the
TB.
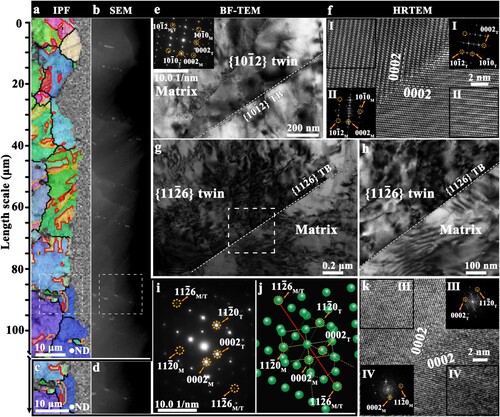
Figure 4. Schmid-factor (SF) determined twinning mode selection. The Schmid-factor maps and corresponding orientation maps of twins: (a to c) Higher SF values (0.441–0.499) in Type I. (d to i) Lower SF values in Type I. (j to l) Higher SF values (0.399–0.409) in Type II. (m to r) Lower SF values in Type II.
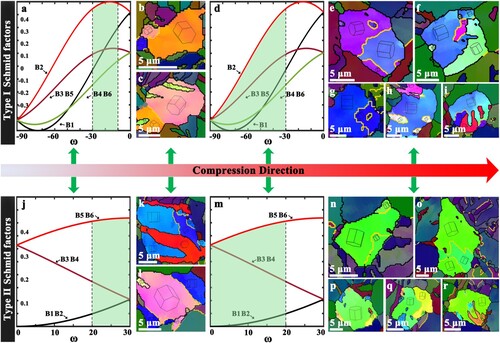
Figure 5. TEM images illustrating the dislocations and cross-slips in the twin.
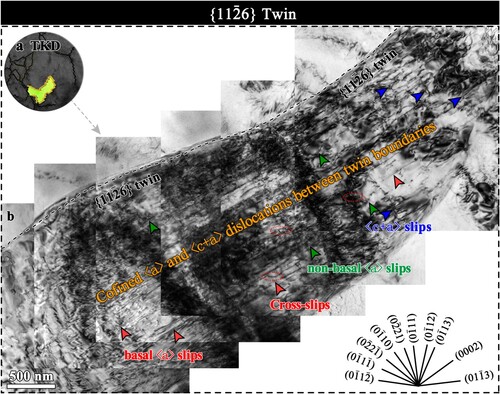
Table 1. Calculated Schmid factors of the eighteen slip systems in Parent grain (Euler angle: 125°, 86°, 17°) and the twin (Euler angle: 84°, 121°, 8°).