
Figures & data
Figure 1. FOD failure of aero-engine fan blades.
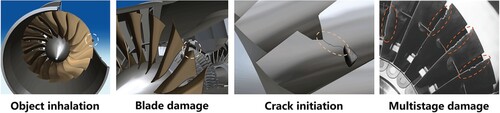
Figure 2. Comparison of three AM processes used for metal manufacturing [Citation50–52].
![Figure 2. Comparison of three AM processes used for metal manufacturing [Citation50–52].](/cms/asset/ccc2fa80-fc5a-4675-8086-d9b7aee88ece/tmrl_a_2275599_f0002_oc.jpg)
Table 1. Comparison of three AM processes used for TC4 titanium alloy [Citation48].
Figure 3. Maintenance specifications on aero-engine blades. (a) CFM-LEAP-1A engine fan rotor blade maintenance [Citation56]; (b) CFM56-3 engine fan rotor blade maintenance [Citation57]; (c) CFM56-7 engine fan rotor blade maintenance [Citation58].
![Figure 3. Maintenance specifications on aero-engine blades. (a) CFM-LEAP-1A engine fan rotor blade maintenance [Citation56]; (b) CFM56-3 engine fan rotor blade maintenance [Citation57]; (c) CFM56-7 engine fan rotor blade maintenance [Citation58].](/cms/asset/d22d8645-6629-4c83-af74-bf1a9d6bc12a/tmrl_a_2275599_f0003_oc.jpg)
Figure 4. LMD repair technology used for aero-engine blades. (a) Titanium alloy blisk blade repaired by LENS process of Optomec Design Company; (b) Nickel-base turbine blade knife-edges repaired by Fraunhofer Laser Technology Association; (c) Titanium alloy blisk blades repaired by Northwestern Polytechnic University.
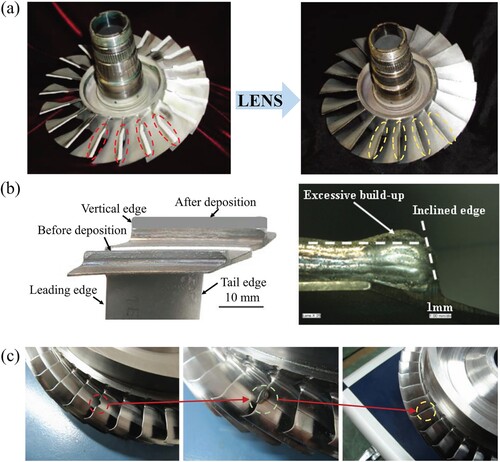
Table 2. Effect of microstructure on HCF strength of AM manufactured titanium alloy.
Table 3. Effect of manufacturing defects on HCF strength of AM processed titanium alloy.
Table 4. Effect of surface roughness on HCF strength of AM processed titanium alloy.
Table 5. Effect of residual stress on HCF strength of AM processed titanium alloy.
Figure 5. Influencing factors of AM on fatigue properties of titanium alloy. Notes: LOF – Lack of fusion, EVS – Extreme Value Statistics, PD – Probabilistic distribution, DAN – Double Annealing.
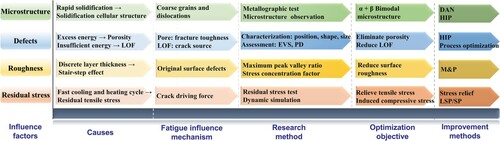
Figure 6. Defects on LAM processed TC17 samples. (a) and (b) Pores and LOFs observed by CT and OM; (c) Fatigue fracture of tensile specimen caused by pores; (d) Fatigue fracture of blade leading edge caused by LOF.
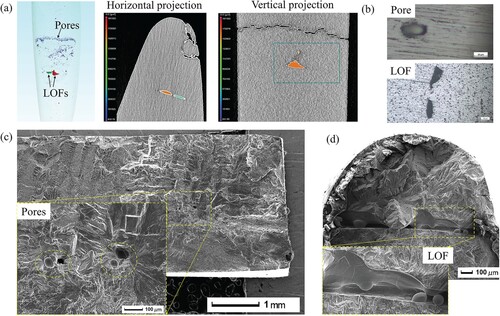
Figure 7. HCF fracture behavior of titanium alloy.
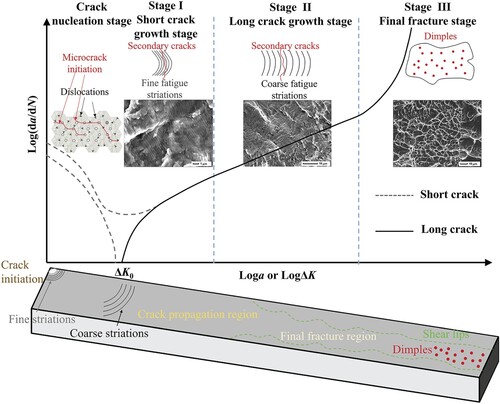
Figure 8. Development of mechanical models for fatigue properties evaluation of AM processed titanium alloy [Citation95,Citation117,Citation149,Citation183,Citation184].
![Figure 8. Development of mechanical models for fatigue properties evaluation of AM processed titanium alloy [Citation95,Citation117,Citation149,Citation183,Citation184].](/cms/asset/bbb31c94-10b6-4dba-b78b-e2e4babc4924/tmrl_a_2275599_f0008_oc.jpg)
Figure 9. Estimation method of effective area of irregular defects and surface defects. Reprinted with permission from Masuo et al. [Citation117] (Copyright (2018) Elsevier).
![Figure 9. Estimation method of effective area of irregular defects and surface defects. Reprinted with permission from Masuo et al. [Citation117] (Copyright (2018) Elsevier).](/cms/asset/2b7cbf1b-4f5b-42ce-b95b-c4642be268ff/tmrl_a_2275599_f0009_oc.jpg)
Figure 10. Interaction of AM defects under fatigue loading. Reprinted with permission from Wu et al. [Citation201] (Copyright (2017) Elsevier).
![Figure 10. Interaction of AM defects under fatigue loading. Reprinted with permission from Wu et al. [Citation201] (Copyright (2017) Elsevier).](/cms/asset/48633c27-4023-4102-b79a-908cc82c2574/tmrl_a_2275599_f0010_oc.jpg)
Figure 11. K–T diagram with El Haddad and Topper corrections (a) Schematic diagram; (b) Experimental data and simulation results. Reprinted with permission from Wycisk et al. [Citation95]. (Copyright (2014) Elsevier).
![Figure 11. K–T diagram with El Haddad and Topper corrections (a) Schematic diagram; (b) Experimental data and simulation results. Reprinted with permission from Wycisk et al. [Citation95]. (Copyright (2014) Elsevier).](/cms/asset/ecdc2c46-bc75-435b-b0e7-f0937f363934/tmrl_a_2275599_f0011_oc.jpg)
Figure 12. Summary of the application of applying ML strategy in predicting the fatigue properties of AM materials (Artificial neural network as an example) [Citation222].
![Figure 12. Summary of the application of applying ML strategy in predicting the fatigue properties of AM materials (Artificial neural network as an example) [Citation222].](/cms/asset/cebc5ae1-a130-4e8b-b16f-68c4634a07d8/tmrl_a_2275599_f0012_oc.jpg)
Figure 13. The fatigue life prediction of AM Ti-6Al-4V alloys with the CDM-ANN/RF method. (a) Computational flowchart; (b) Variation of the predicted fatigue life against experimental data by ML. Reprinted with permission from Zhan et al. [Citation223] (Copyright (2021) Elsevier).
![Figure 13. The fatigue life prediction of AM Ti-6Al-4V alloys with the CDM-ANN/RF method. (a) Computational flowchart; (b) Variation of the predicted fatigue life against experimental data by ML. Reprinted with permission from Zhan et al. [Citation223] (Copyright (2021) Elsevier).](/cms/asset/5cca210f-f790-463a-95ef-72eb2cc0e332/tmrl_a_2275599_f0013_oc.jpg)
Figure 14. The fatigue life prediction of LMD TA2-TA15 and TC4-TC11 titanium alloys with the CDM-RF method. (a) CDM-RF strategy; (b) Smooth specimen; (c) Notched specimen; (d) Prediction results for AM TA2-TA15; (e) Prediction results for AM TC4-TC11. Reprinted with permission from Zhan et al. [Citation224] (Copyright (2021) Elsevier).
![Figure 14. The fatigue life prediction of LMD TA2-TA15 and TC4-TC11 titanium alloys with the CDM-RF method. (a) CDM-RF strategy; (b) Smooth specimen; (c) Notched specimen; (d) Prediction results for AM TA2-TA15; (e) Prediction results for AM TC4-TC11. Reprinted with permission from Zhan et al. [Citation224] (Copyright (2021) Elsevier).](/cms/asset/187eea81-d531-4d90-b70a-befdb0664796/tmrl_a_2275599_f0014_oc.jpg)
Figure 15. The internal defects and fatigue life prediction of LPBF Ti-6Al-4V alloys with the CNN method. (a) Architecture for defect classification; (b) Fatigue life and XCT results for four fatigue parts from the training and testing data sets. Reprinted with permission from Snow et al. [Citation225] (Copyright (2021) Elsevier).
![Figure 15. The internal defects and fatigue life prediction of LPBF Ti-6Al-4V alloys with the CNN method. (a) Architecture for defect classification; (b) Fatigue life and XCT results for four fatigue parts from the training and testing data sets. Reprinted with permission from Snow et al. [Citation225] (Copyright (2021) Elsevier).](/cms/asset/e9c2e837-4c28-410e-b59a-d6fd7e9ce811/tmrl_a_2275599_f0015_oc.jpg)
Figure 16. The fatigue life prediction of SLM Ti-6Al-4V alloys with the PPgNN method. (a) Architecture for fatigue analysis considering missing data; (b) Prediction comparison between model trained with missing data and model trained with complete data; (c) Sensitivity indicators for process parameters. Reprinted with permission from Chen et al. [Citation226] (Copyright (2021) Elsevier).
![Figure 16. The fatigue life prediction of SLM Ti-6Al-4V alloys with the PPgNN method. (a) Architecture for fatigue analysis considering missing data; (b) Prediction comparison between model trained with missing data and model trained with complete data; (c) Sensitivity indicators for process parameters. Reprinted with permission from Chen et al. [Citation226] (Copyright (2021) Elsevier).](/cms/asset/9b0db229-5ab0-49b9-98ec-395113edab11/tmrl_a_2275599_f0016_oc.jpg)
Data availability statement
The datasets generated during and/or analyzed during the current study are available from the corresponding author on reasonable request.