Figures & data
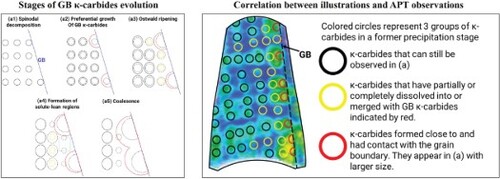
Figure 1. Precipitation state in solution-treated condition. (a) 3D atomic map of C and B in a GB-containing APT sample. (b) Comparison of observed frequency distribution of elemental concentrations with the binomial frequency distribution reveals the absence of chemical clustering in the sample. (c) Diffraction pattern along the [001] zone axis.
![Figure 1. Precipitation state in solution-treated condition. (a) 3D atomic map of C and B in a GB-containing APT sample. (b) Comparison of observed frequency distribution of elemental concentrations with the binomial frequency distribution reveals the absence of chemical clustering in the sample. (c) Diffraction pattern along the [001] zone axis.](/cms/asset/9c689973-58b4-4ea7-b593-cdeb42934fa7/tmrl_a_2284321_f0001_oc.jpg)
Figure 2. Precipitation state in samples age-hardened at 550°C for 16 h. (a) 3D atomic map of C and B to highlight GB position. (b, c) κ-carbides visualization via 3D concentration maps of Al + C from a GB edge-on and GB face-on perspectives, respectively. (d) 4D-STEM observations of the GB region imaged along the [001] zone axis. (d1) Virtual dark field image. (d2, d3) diffraction patterns from the matrix and a GB κ-carbides, respectively. (e) The direction of GB κ-carbides growth observed in this work (top) compared with the growth direction during discontinuous precipitation (bottom).
![Figure 2. Precipitation state in samples age-hardened at 550°C for 16 h. (a) 3D atomic map of C and B to highlight GB position. (b, c) κ-carbides visualization via 3D concentration maps of Al + C from a GB edge-on and GB face-on perspectives, respectively. (d) 4D-STEM observations of the GB region imaged along the [001] zone axis. (d1) Virtual dark field image. (d2, d3) diffraction patterns from the matrix and a GB κ-carbides, respectively. (e) The direction of GB κ-carbides growth observed in this work (top) compared with the growth direction during discontinuous precipitation (bottom).](/cms/asset/11584a7d-1c4f-46f4-b9ab-10541d9803ac/tmrl_a_2284321_f0002_oc.jpg)
Figure 3. Analysis of an age-hardened GB-containing APT sample. (a) 3D atomic map of C and B to highlight the GB position. (b, c) κ-carbides visualization via sections in the 3D concentration map of Al + C from GB face-on and GB edge-on perspectives, respectively. (d–f) 1D concentration profiles, (d) parallel to the GB, (e) perpendicular to the GB and (f) in the GB plane, as indicated by black solid, dotted and dashed lines, respectively. The red horizontal line at 8 at.% signifies the C concentration used to identify κ-carbides.
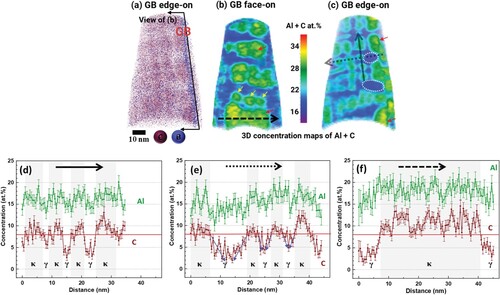
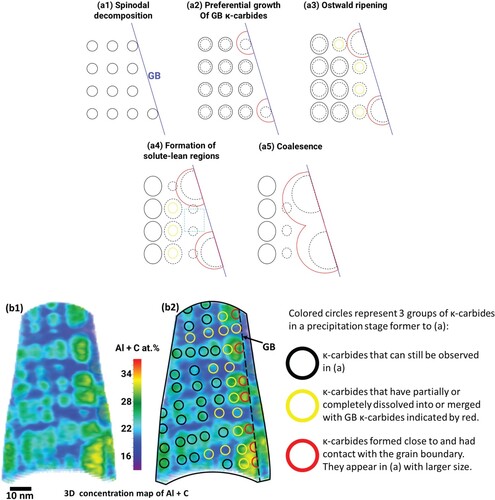
Figure 4. Illustrations of the formation and growth mechanism of grain boundary (GB) κ-carbides. (a) A sketch of different stages of the formation and growth of κ-carbides. Each stage is redrawn in dashed lines in the following stage. Black circles: κ-carbides, red circles: GB κ-carbides, yellow circles: dissolving κ-carbides. Teal square: solute-lean region. (b) Associating illustrations with APT observations. (b1) A section in the 3D concentration map of the age-hardened sample in Figure . (b2) Overlayed image of (b1) with a schematic of κ-carbides in an aging step prior to (b1).