
Figures & data

Figure 1. At intermediate temperatures, Ni-based single crystal superalloys do have similar microstructures under different deformation conditions: (a) The tensile curve of the experimental alloy at 750 °C and the orientation before and after fracture; (b) The microstructure of the experimental alloy after tensile at 750 °C; (c) The tensile creep curve of the experimental alloy at 750 °C/750 MPa and the orientation before and after creep fracture; (d) The microstructure of the experimental alloy after tensile creep at 750 °C/750 MPa.
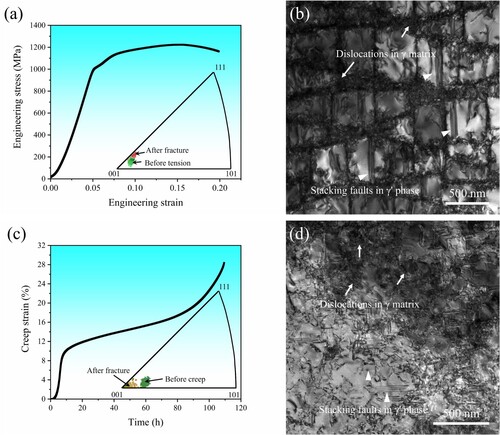
Figure 2. (a) Schematic diagram of the tensile specimen for in-situ EBSD analysis; (b) The macroscopic feature and the relationship between tensile direction and EBSD coordinates; (c) The stress-strain curve of the specimen for in-situ EBSD analysis.
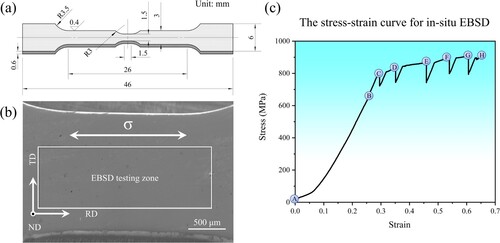
Figure 3. Surface morphology evolution of the specimen at different deformation stages in Figure (c), and (a)-(h) represent stages A-H, respectively.
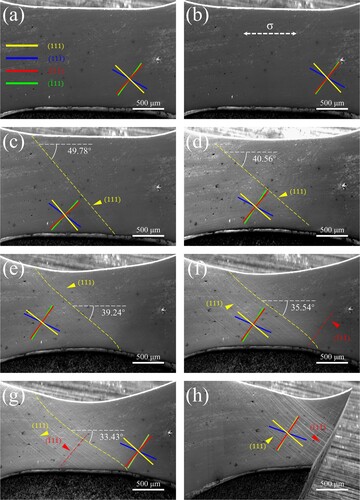
Figure 4. Orientation evolution of the specimen at different deformation stages and corresponding Schmid factors for twelve {111} 〈110〉 slip systems.
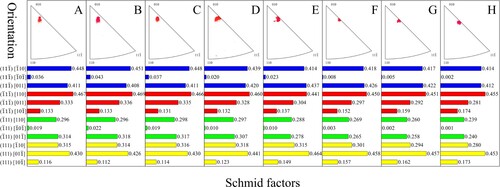
Table 1. Orientation of the specimen at different deformation stages.
Figure 5. (a) The standard [010] stereographic projection; (b) The orientation rotation path of several alloys during tensile deformation at intermediate temperatures; (c) The orientation rotation path of several alloys during tensile creep at intermediate temperatures and high stress; (d) Illustration of orientation rotation in a standard stereographic triangle under {111} 〈110〉 slip; (e) Illustration of orientation rotation in a standard stereographic triangle under {111} 〈112〉 slip.
![Figure 5. (a) The standard [010] stereographic projection; (b) The orientation rotation path of several alloys during tensile deformation at intermediate temperatures; (c) The orientation rotation path of several alloys during tensile creep at intermediate temperatures and high stress; (d) Illustration of orientation rotation in a standard stereographic triangle under {111} 〈110〉 slip; (e) Illustration of orientation rotation in a standard stereographic triangle under {111} 〈112〉 slip.](/cms/asset/d63022c0-7123-4bcf-9970-9eafc1a444b6/tmrl_a_2304255_f0005_oc.jpg)