Figures & data
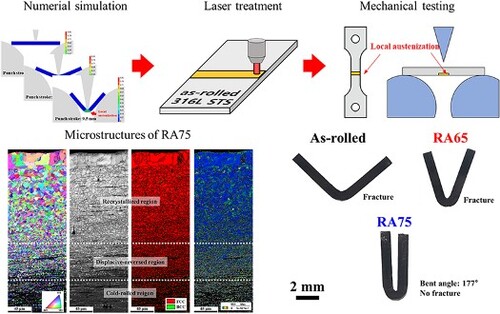
Figure 1. (a) Schematics showing the procedure of the proposed strategy for local austenitization aimed at enhancing forming. (b) Distribution of equivalent plastic strain in the bending simulation to select the region for local austenitization.
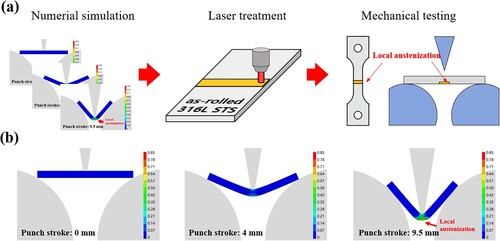
Table 1. Processing conditions for laser treatment.
Figure 2. Simulation results for thermal analysis showing (a) temperature distribution during laser treatment and (b) peak temperature along the distance from the surface. (c) XRD patterns for the present samples. The magnified patterns correspond to the 2θ angles ranging from 40° to 55°.
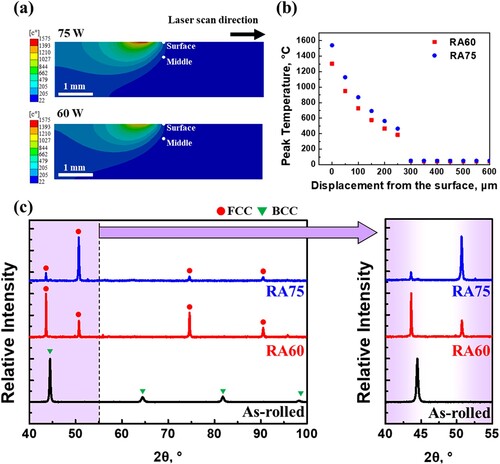
Figure 3. EBSD maps including (a, e) inverse pole figure, (b, f) image quality, (c, g) phase, (d, h) GND density for the (a-d) RA60 and the (e-h) RA75 samples.
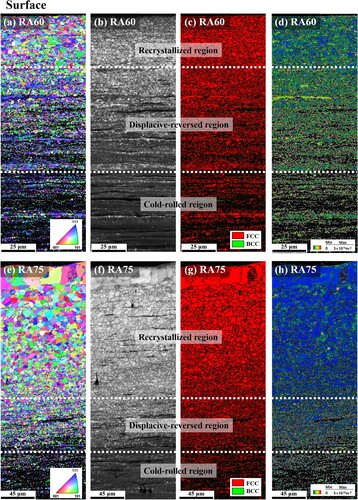
Figure 4. (a) Engineering strain-stress curves and (b) load-displacement curve of the bending test. (c) Images of the samples following the bending test. (d) A bar chart showing the comparison of elongation and bending limit among the present samples.
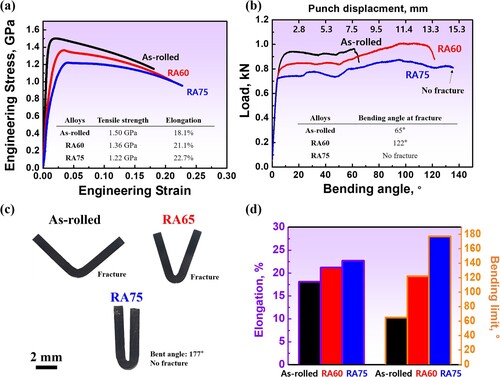
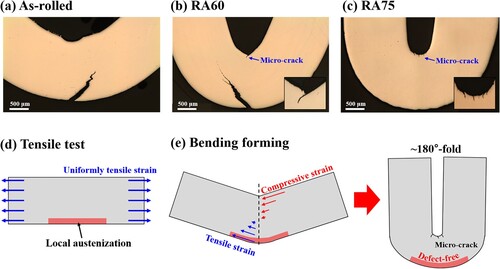
Figure 5. (a) OM images of the bent samples of (a) As-rolled, (b) RA60, and (c) RA75 samples. The insert in (b, c) is the magnified image of the micro crack. Schematics for the samples with local austenitization in (d) tensile testing and (e) bending forming.