
Figures & data

Figure 1. (a) Schematic representation of a typical car engine, highlighting friction-induced wear as the primary cause of failure. (b) Schematic depiction of tribolayer formation under sliding contact. (c) Heterogeneous structures induced by tribo-effects formed under (c1) conventional room temperature conditions and (c2) extreme conditions. (d) Examples of heterogeneous design variants, including (d1) gradient structures, (d2) laminated structures, and (d3) structures integrating mixed features.
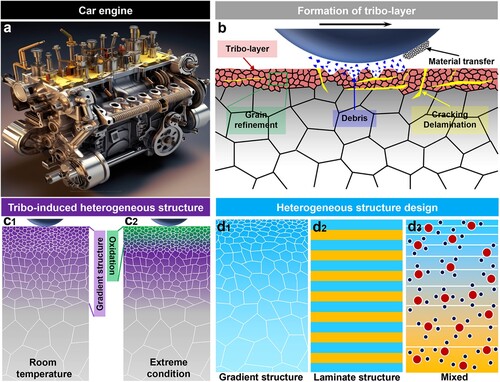
Figure 2. (a1) The TEM and (a2) magnified HRTEM images in the topmost oxidation layer for the CoFeNi2 MEA worn at 5 N after 9000 cycles. (a3) Specific COF vs. wear rate maps of tribological CoCrFeMnNi-based HEAs/MEAs, including the present results of CoFeNi2 MEA [Citation40]. (b1) TEM, (b2) STEM and (b3) HRTEM images of the amorphous-crystalline nanocomposite on the surface. (b4) Friction coefficients as a function of sliding cycles for the TiNbZr-based alloys with (b5) 2D cross-sectional profiles of the wear tracks [Citation41]. (c1) A cross-sectional bright-field TEM image for the TaMoNb film after dry sliding against a Si3N4 ball at room temperature. SEM images of the nanopillars composed of nanocomposite (I) and gradient nanostructure (II) before (c2) and after (c3) compression with (c4) typical compressive engineering stress–strain curves [Citation42]. (d1) A cross-sectional HAADF-STEM image of the Cu90Ag10 alloy worn against a martensitic steel 440C disk. (d2) Hardness and (d3) spacing between two consecutive Ag layers as a function of depth below the sliding surface [Citation57].
![Figure 2. (a1) The TEM and (a2) magnified HRTEM images in the topmost oxidation layer for the CoFeNi2 MEA worn at 5 N after 9000 cycles. (a3) Specific COF vs. wear rate maps of tribological CoCrFeMnNi-based HEAs/MEAs, including the present results of CoFeNi2 MEA [Citation40]. (b1) TEM, (b2) STEM and (b3) HRTEM images of the amorphous-crystalline nanocomposite on the surface. (b4) Friction coefficients as a function of sliding cycles for the TiNbZr-based alloys with (b5) 2D cross-sectional profiles of the wear tracks [Citation41]. (c1) A cross-sectional bright-field TEM image for the TaMoNb film after dry sliding against a Si3N4 ball at room temperature. SEM images of the nanopillars composed of nanocomposite (I) and gradient nanostructure (II) before (c2) and after (c3) compression with (c4) typical compressive engineering stress–strain curves [Citation42]. (d1) A cross-sectional HAADF-STEM image of the Cu90Ag10 alloy worn against a martensitic steel 440C disk. (d2) Hardness and (d3) spacing between two consecutive Ag layers as a function of depth below the sliding surface [Citation57].](/cms/asset/7c78a3e8-8ea5-40d7-ad42-ca7464db0694/tmrl_a_2356282_f0002_oc.jpg)
Figure 3. (a1) Cross-sectional TEM characterization of the worn Ni–27Cr superalloy after 9000 cycles at 800°C with corresponding EDS (a2–a4) mapping results. Magnified TEM observation of the (a5) unoxidized regions and (a6) one DRX grain in the glaze layer. (a7) Summary of wear rates for the Ni–27Cr sample and some commercial Ni-based superalloys from the literature [Citation63]. (b1) SEM characterization of the subsurface under the wear track of the pearlite steel after sliding test at 550°C. HAADF STEM images of (b2) fine and (b3) coarse recrystallized region. (b4) Wear rate of various existing steels and present pearlitic multi-principal element alloy [Citation61]. (c1) Cross-sectional SEM observation and associated (c2) EDX linescan analysis of the wear track after the glaze layer formation in the Haynes 25 superalloy. (c3) TEM observation of the lamella in bright field [Citation62].
![Figure 3. (a1) Cross-sectional TEM characterization of the worn Ni–27Cr superalloy after 9000 cycles at 800°C with corresponding EDS (a2–a4) mapping results. Magnified TEM observation of the (a5) unoxidized regions and (a6) one DRX grain in the glaze layer. (a7) Summary of wear rates for the Ni–27Cr sample and some commercial Ni-based superalloys from the literature [Citation63]. (b1) SEM characterization of the subsurface under the wear track of the pearlite steel after sliding test at 550°C. HAADF STEM images of (b2) fine and (b3) coarse recrystallized region. (b4) Wear rate of various existing steels and present pearlitic multi-principal element alloy [Citation61]. (c1) Cross-sectional SEM observation and associated (c2) EDX linescan analysis of the wear track after the glaze layer formation in the Haynes 25 superalloy. (c3) TEM observation of the lamella in bright field [Citation62].](/cms/asset/fe10b588-81a8-4b6f-b9d6-91e949bf05f4/tmrl_a_2356282_f0003_oc.jpg)
Figure 4. Structure and friction of gradient nanograined (GNG) materials [Citation17,Citation75,Citation88]. (a) Typical longitudinal-sectional scanning electron microscopy image of GNG Cu–Ag sample. (b) Variation of longitudinal (dl) and transversal grain sizes (dt) and microhardness along depth from the surface. Error bars represent the SD of grain size and hardness measurements. (c) Variation of COFs with sliding cycles for the CG, NG, and GNG Cu–Ag samples sliding against WC-Co balls. (d) Measured surface height profiles along the sliding direction in the CG, NG, and GNG Cu–Ag samples after different sliding cycles (as indicated), with corresponding confocal laser microscopy images for surface morphologies after sliding for 18,000 cycles (above). (e) The xz-component of the stress field in the middle of the wear scar along the sliding direction. (f) Variation of applied stress at the center and the front of contact along depth from the sliding surface in the GNG (COF = 0.37) and NG pure Cu samples. (g) Variation of COFs with initial hardness for all sorts of metals and alloys, including the CG, NG and GNG structures.
![Figure 4. Structure and friction of gradient nanograined (GNG) materials [Citation17,Citation75,Citation88]. (a) Typical longitudinal-sectional scanning electron microscopy image of GNG Cu–Ag sample. (b) Variation of longitudinal (dl) and transversal grain sizes (dt) and microhardness along depth from the surface. Error bars represent the SD of grain size and hardness measurements. (c) Variation of COFs with sliding cycles for the CG, NG, and GNG Cu–Ag samples sliding against WC-Co balls. (d) Measured surface height profiles along the sliding direction in the CG, NG, and GNG Cu–Ag samples after different sliding cycles (as indicated), with corresponding confocal laser microscopy images for surface morphologies after sliding for 18,000 cycles (above). (e) The xz-component of the stress field in the middle of the wear scar along the sliding direction. (f) Variation of applied stress at the center and the front of contact along depth from the sliding surface in the GNG (COF = 0.37) and NG pure Cu samples. (g) Variation of COFs with initial hardness for all sorts of metals and alloys, including the CG, NG and GNG structures.](/cms/asset/1c8a53ef-e2b2-484c-9a1a-a448433be5f1/tmrl_a_2356282_f0004_oc.jpg)
Figure 5. Structure and friction of heterogeneous laminates and other heterostructured materials [Citation90,Citation91,Citation97]. (a) Friction of heterogeneous Cu/CuZn laminate: EBSD IPF mappings of the laminates with a layer spacing of (a1) 20 µm, (a2) variations of the COF with the layer spacing for the laminates sliding perpendicular and parallel to the interface under a normal load of 5 N, TEM images of worn subsurface for Laminate-50 under the sliding direction (a3) perpendicular, (a4) parallel to the interface (indicated by the white dashed line). (b) Friction of heterogeneous Gr/Cu laminate: (b1) TEM image for a typical Gr/Cu interface, (b2) COF curves for three sliding directions (I.P. (in-plane surface), C.S.-P, and C.S.-V (parallel and vertical to the lamellae on cross-section surface)) of the Gr/Cu laminates, (b3) finite element simulating results for C.S.-V. (c) Friction of heterogeneous TaC/Ta core-shell-like nanocomposite: (c1) HRTEM image implying the core-shell-like structure of TaC/Ta nanocomposite, (c2) COF values of TaC/Ta nanocomposites (sample # 1 with a Ta layer thickness of ∼ 1.5 nm and sample # 2 with a Ta layer thickness of ∼ 5.5 nm), TaC and Ti–6Al–4V under dry air and SBF solution, (c3) typical XPS core level spectra of Ta4f performed on the worn surface for TaC monolayer and TaC/Ta nanocomposites (sample # 1 and sample # 2).
![Figure 5. Structure and friction of heterogeneous laminates and other heterostructured materials [Citation90,Citation91,Citation97]. (a) Friction of heterogeneous Cu/CuZn laminate: EBSD IPF mappings of the laminates with a layer spacing of (a1) 20 µm, (a2) variations of the COF with the layer spacing for the laminates sliding perpendicular and parallel to the interface under a normal load of 5 N, TEM images of worn subsurface for Laminate-50 under the sliding direction (a3) perpendicular, (a4) parallel to the interface (indicated by the white dashed line). (b) Friction of heterogeneous Gr/Cu laminate: (b1) TEM image for a typical Gr/Cu interface, (b2) COF curves for three sliding directions (I.P. (in-plane surface), C.S.-P, and C.S.-V (parallel and vertical to the lamellae on cross-section surface)) of the Gr/Cu laminates, (b3) finite element simulating results for C.S.-V. (c) Friction of heterogeneous TaC/Ta core-shell-like nanocomposite: (c1) HRTEM image implying the core-shell-like structure of TaC/Ta nanocomposite, (c2) COF values of TaC/Ta nanocomposites (sample # 1 with a Ta layer thickness of ∼ 1.5 nm and sample # 2 with a Ta layer thickness of ∼ 5.5 nm), TaC and Ti–6Al–4V under dry air and SBF solution, (c3) typical XPS core level spectra of Ta4f performed on the worn surface for TaC monolayer and TaC/Ta nanocomposites (sample # 1 and sample # 2).](/cms/asset/465d5dfc-6e54-4400-b0c5-8cc02c4a8860/tmrl_a_2356282_f0005_oc.jpg)
Figure 6. Comparison between the tribological properties of heterostructured (HS) [Citation17,Citation75,Citation76,Citation79,Citation80,Citation91,Citation97,Citation101–114] and homogeneous metals and alloys: Wear rate versus coefficient of friction (COF). The light gray oval in the top right corner suggests that homogeneous metals and alloys have both a high wear rate and COF, indicative of suboptimal tribological behavior. Conversely, the light blue oval highlights the enhancements in tribological performance achieved by introducing a heterostructure. The red region in the bottom left suggests the potential for further improvement in tribological behavior through optimized heterostructure.
![Figure 6. Comparison between the tribological properties of heterostructured (HS) [Citation17,Citation75,Citation76,Citation79,Citation80,Citation91,Citation97,Citation101–114] and homogeneous metals and alloys: Wear rate versus coefficient of friction (COF). The light gray oval in the top right corner suggests that homogeneous metals and alloys have both a high wear rate and COF, indicative of suboptimal tribological behavior. Conversely, the light blue oval highlights the enhancements in tribological performance achieved by introducing a heterostructure. The red region in the bottom left suggests the potential for further improvement in tribological behavior through optimized heterostructure.](/cms/asset/d503964c-9eb4-4e63-818a-d6f69827d955/tmrl_a_2356282_f0006_oc.jpg)