Figures & data
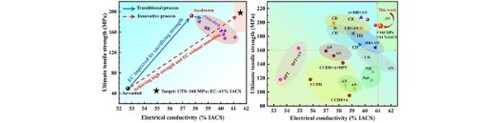
Figure 1. STEM results of Al-0.2Zr-0.06Sc alloys produced by different processes: (a1–a3) Bright-field micrographs; (b1–d1) Al-Fe-Si impurity phase and EDS mapping of Fe and Si elements; (b2 and b3) Dark-field micrographs and their corresponding particle size distribution in (c2 and c3); (d2, d3) High-resolution transmission electron microscope (HRTEM) micrographs and their corresponding FFT images; (a4–d4) High-angle annular dark field (HAADF) micrograph of Al3(Zr,Sc) precipitates and EDS mapping. Among them, (a2–d2) rods are aged at 250°C/24 h + 395°C/168 h.
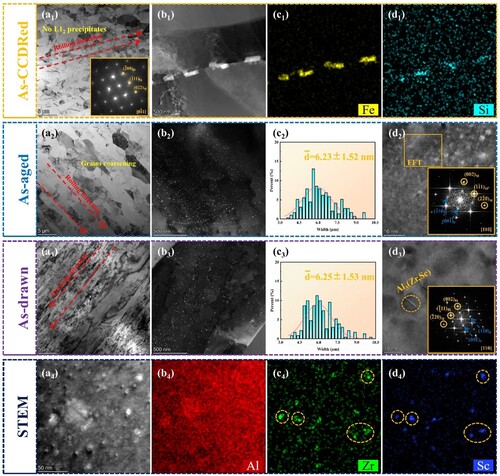
Figure 2. The orientation distribution maps of Al-0.2Zr-0.06Sc alloys: (a1–c1) as-CCDRed sample; (a2–c2) as-aged sample at 250°C/24 h + 395°C/168 h; (a3–c3) as-drawn sample; (a1–a3) radial direction; (b1–b3) grain size distributions; (c1–c3) axial direction. (d) Schematic diagram of sample observation; (e) Statistical results corresponding to the grain lengths and widths. DD: Deformation direction; RD: Rolling direction.
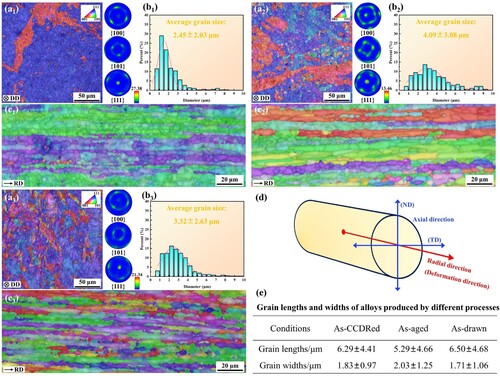
Figure 3. UTS and EC of Al-0.2Zr-0.06Sc alloy wires were compared with other heat-resistant Al conductors produced by different processes. (CD: Cold drawing; A: Ageing treatment; HR: Hot rolled; CR: Cold rolled; AN: Annealing treatment; and HPT: High pressure torsion) [Citation9,Citation14–22].
![Figure 3. UTS and EC of Al-0.2Zr-0.06Sc alloy wires were compared with other heat-resistant Al conductors produced by different processes. (CD: Cold drawing; A: Ageing treatment; HR: Hot rolled; CR: Cold rolled; AN: Annealing treatment; and HPT: High pressure torsion) [Citation9,Citation14–22].](/cms/asset/84e66d61-2512-45d7-8ce7-43a41f9dbe57/tmrl_a_2360161_f0003_oc.jpg)
Figure 4. The strengthening contribution provided by different mechanisms was calculated using Equations (4)–(11) in (a); and difference between calculated and experimental results in (b).
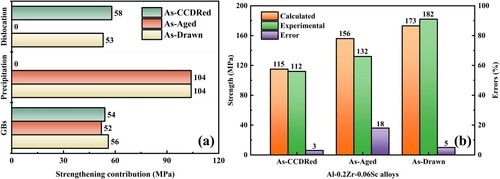
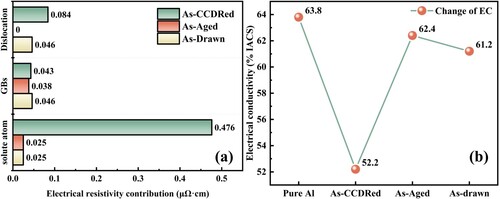
Figure 5. The influence of different mechanisms on the electrical resistivity was calculated using Equations (12)–(14) in (a); The change of aged/168h-wire on the EC during processing paths in (b).