Figures & data
Figure 1. Grain structure of L-PBF Al–Mg–Sc–Zr alloy as-built specimen. (a) EBSD band-contrast image of overall grain structure. (b) Enlarged inverse polar figure (IPF) map acquired from boxed [blue-coloured in (a)] equiaxed FG region; (c) Grain boundary misorientation profile acquired from (b), presented together with Mackenzie random distribution profile; (d) (100) polarogram acquired from FG region [(b)]; (e) (100) polarogram acquired from boxed [red-coloured in (a)] columnar CG region.
![Figure 1. Grain structure of L-PBF Al–Mg–Sc–Zr alloy as-built specimen. (a) EBSD band-contrast image of overall grain structure. (b) Enlarged inverse polar figure (IPF) map acquired from boxed [blue-coloured in (a)] equiaxed FG region; (c) Grain boundary misorientation profile acquired from (b), presented together with Mackenzie random distribution profile; (d) (100) polarogram acquired from FG region [(b)]; (e) (100) polarogram acquired from boxed [red-coloured in (a)] columnar CG region.](/cms/asset/3ac0612a-4aea-413f-adb9-8ec5ab148d10/tmrl_a_2366878_f0001_oc.jpg)
Figure 2. Microstructure of L-PBF Al–Mg–Sc–Zr alloy after direct-ageing at 325°C/4 h. (a) EBSD band-contrast image of overall grain structure; (b) KAM map corresponding to (a); (c) Enlarged IPF map acquired from boxed FG region in (a). (d) Grain boundary misorientation profile acquired from (c), shown together with Mackenzie random distribution. (e) TEM dark-field image of Al3 (Sc, Zr) nanoprecipitates, with corresponding SAED patterns shown in inset image; (f) Statistics of Al3 (Sc, Zr) precipitate. Radius distribution for precipitates with radius of 1–3 nm is shown in enlarged inset image, which comprises >95% of total valid precipitate counts. The mean precipitate radius determined from TEM images is 1.5 ± 0.6 nm.
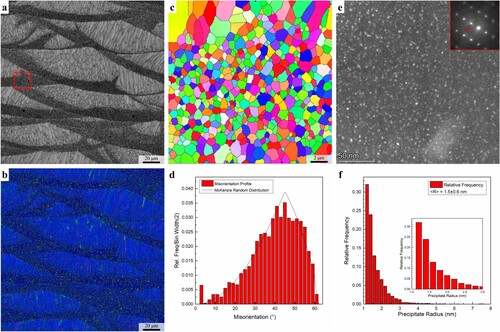
Figure 3. Microstructure of L-PBF Al–Mg–Sc–Zr alloy after direct-ageing at 325°C/4 h and thermal exposure at 500°C/2 h (a) EBSD IPF map of overall grain structure; (b) KAM map corresponds to (a); (c) Enlarged EBSD IPF map in adjutant to an abnormal grain. Notice that the abnormal grain has no direct contact with other abnormal grains or CGs; (d) KAM map correspond to (c); (e) TEM dark-field image of Al3 (Sc, Zr) nanoprecipitates, with corresponding SAED patterns shown in inset image; (f) Statistics of Al3 (Sc, Zr) precipitate radius distribution. The mean precipitate radius determined from TEM images is 5.2 ± 1.9 nm.
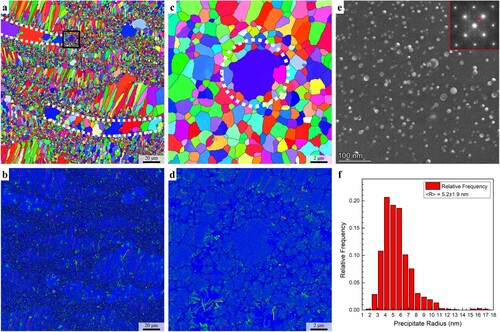
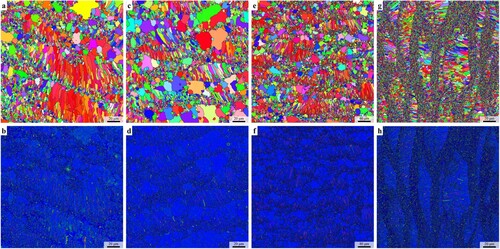
Figure 4. EBSD IPF map (a, c, e, g) and corresponding KAM map (b, d, f, h) of L-PBF Al–Mg–Sc–Zr alloy after direct-aged at 325°C/4 h and prolonged thermal exposure at: (a, b) 500°C/4 h; (c,d) 500°C/8 h; (e, f) 500°C/24 h; (g,h) 300°C/96 h.