Figures & data
Figure 1. (a) Schematic illustration detailing the overall experimental procedure. The operation protocols for the L-PBF process are followed by subsequent post-treatment of the HT and DCT, and hydrogen charging. The tensile sample and microstructure observation areas are also shown; (b) The AP sample on the X-Y plane showing typical defects. The insert presents the ratio of elemental compositions; (c) Microstructure of the AP sample on the X-Y plane with element distributions.
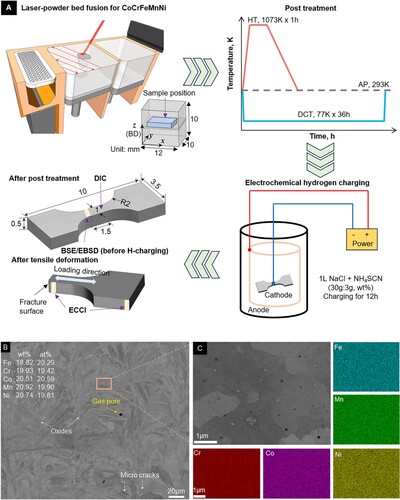
Figure 2. (a) Tensile stress-strain curves of the AP, HT, and DCT samples with/without hydrogen charging (marked by dashed/solid lines). The symbols ‘⊗’ indicate the threshold of fracture points; (b) Work hardening rate of the samples; (c) Ashby diagrams plotting UFE versus UTS for the present work in comparison with reported results [Citation6,Citation7]. The symbols ‘♦/♢ filled/unfilled inside denote the matrix with/without hydrogen charging; (d) UFE*(YS + UTS)/2 plotted versus YS for the FCC alloys in various conditions.
![Figure 2. (a) Tensile stress-strain curves of the AP, HT, and DCT samples with/without hydrogen charging (marked by dashed/solid lines). The symbols ‘⊗’ indicate the threshold of fracture points; (b) Work hardening rate of the samples; (c) Ashby diagrams plotting UFE versus UTS for the present work in comparison with reported results [Citation6,Citation7]. The symbols ‘♦/♢ filled/unfilled inside denote the matrix with/without hydrogen charging; (d) UFE*(YS + UTS)/2 plotted versus YS for the FCC alloys in various conditions.](/cms/asset/9fe66bda-d291-4be7-a817-3bb82374066f/tmrl_a_2371521_f0002_oc.jpg)
Table 1. Summary of mechanical properties of the AP, HT, and DCT samples in hydrogen-free/charged status after tensile tests.
Figure 3. Grain morphology, boundary, and KAM in the X-Y plane by EBSD maps of H-free samples: (a) AP, (b) HT, and (c) DCT. The ECC images show more spidery columnar grains produced by DCT, not seen in AP and HT, in the X-Z plane. L/HAGB and TB stand for low/high angle grain boundary and twin boundary, respectively.
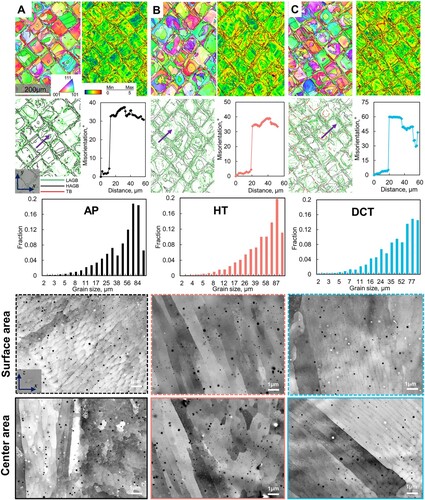
Figure 4. ECC images of surface and center areas of samples near the fracture area in the X-Z plane of deformed specimens: (a) AP-H, (b) HT-H, and (c) DCT-H. The yellow arrows indicate nano-sized deformation twins.
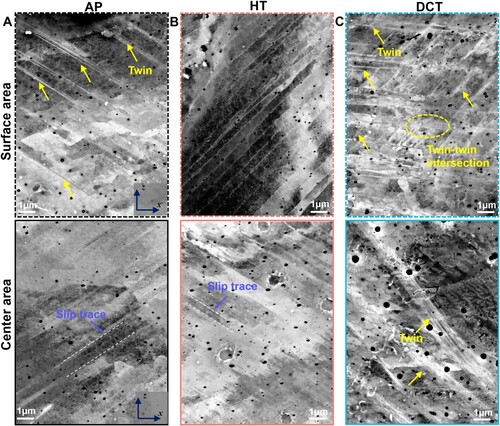
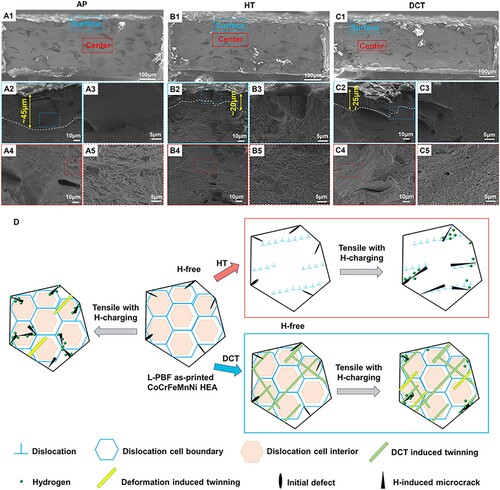
Figure 5. Fracture mechanisms of H-charged L-PBF CoCrFeMnNi HEA: (a) AP, (b) HT, and (c) DCT. Blue (surface area) indicates the H-affected zone, and red (center area) indicates the less-H-affected zone; (d) Schematic diagram of the microstructural evolution subjected to post-treatments and subsequent tensile deformation after hydrogen charging.