Figures & data

Figure 1. (a) EBSD inverse pole figure (IPF) of the present TWIP steel sample; lower right inset shows the XRD profile, confirming a single FCC structure. (b) SEM image of the three indents in the [001]-oriented grain; inset depicts the position for the preparation of TEM samples using FIB lift-out. (c) Load–displacement (P–h) curves of the nanoindentation tests at different strain rates; (d) plot of normalized displacement fluctuation (Δh/h) versus h; Δh represents the displacement residual between the experimental and smoothed displacement–time (h–t) curve (Figure S3).
![Figure 1. (a) EBSD inverse pole figure (IPF) of the present TWIP steel sample; lower right inset shows the XRD profile, confirming a single FCC structure. (b) SEM image of the three indents in the [001]-oriented grain; inset depicts the position for the preparation of TEM samples using FIB lift-out. (c) Load–displacement (P–h) curves of the nanoindentation tests at different strain rates; (d) plot of normalized displacement fluctuation (Δh/h) versus h; Δh represents the displacement residual between the experimental and smoothed displacement–time (h–t) curve (Figure S3).](/cms/asset/008fc34d-4d00-40da-8129-cc9f58698dcd/tmrl_a_2380101_f0001_oc.jpg)
Figure 2. The relation between the hardness and indentation strain rate.
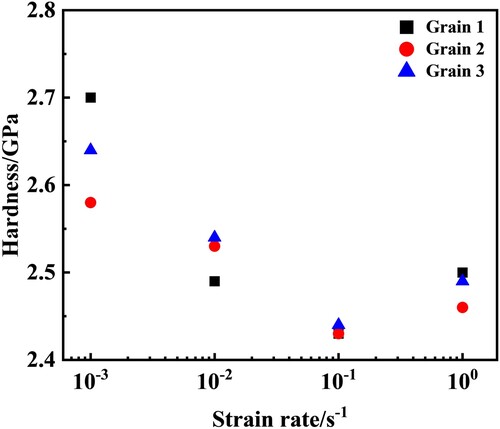
Figure 3. (a) Scanning transmission electron microscopy (STEM) dark-field image of the microstructure beneath the indent at the strain rate of 10−1 s−1; lower right inset shows the selected area diffraction pattern (SADP) of the area represented by the dashed red circle. The zone axis is [0 1 1]. Twin spots and streaking lines in SADP indicate the existence of deformation twins and stacking faults. (b), (c) and (d) are the magnified images of the regions denoted by dashed rectangles in (a), revealing the presence of dislocations and deformation twins beneath the indent. (e) TEM dark-field image of the region denoted by a dashed blue rectangle in (a), demonstrating the morphologies of deformation twins.
![Figure 3. (a) Scanning transmission electron microscopy (STEM) dark-field image of the microstructure beneath the indent at the strain rate of 10−1 s−1; lower right inset shows the selected area diffraction pattern (SADP) of the area represented by the dashed red circle. The zone axis is [0 1 1]. Twin spots and streaking lines in SADP indicate the existence of deformation twins and stacking faults. (b), (c) and (d) are the magnified images of the regions denoted by dashed rectangles in (a), revealing the presence of dislocations and deformation twins beneath the indent. (e) TEM dark-field image of the region denoted by a dashed blue rectangle in (a), demonstrating the morphologies of deformation twins.](/cms/asset/ef48cf1e-4853-479f-9eb7-dcd3e52b8fcc/tmrl_a_2380101_f0003_oc.jpg)
Table 1. Characteristics of the deformation twins beneath the indents at different strain rates; Tt is the total twin thickness. Tm denotes the mean value of the thickness of each twin bundle and N is the number of twin bundles.
Figure 4. (a) STEM dark-field image of the microstructure beneath the indent at the strain rate of 10−3 s−1; lower right inset depicts the SADP of the area represented by the dashed red circle. The zone axis is [0 1 1]. Twin spots and streaking lines in SADP indicate the existence of deformation twins and stacking faults. (b), (c) and (d) are the magnified images of the region denoted by dashed rectangles in (a), revealing the presence of dislocations and deformation twins beneath the indent. (e) TEM dark-field image of the region represented by a dashed blue rectangle in (a) showing the morphologies of deformation twins.
![Figure 4. (a) STEM dark-field image of the microstructure beneath the indent at the strain rate of 10−3 s−1; lower right inset depicts the SADP of the area represented by the dashed red circle. The zone axis is [0 1 1]. Twin spots and streaking lines in SADP indicate the existence of deformation twins and stacking faults. (b), (c) and (d) are the magnified images of the region denoted by dashed rectangles in (a), revealing the presence of dislocations and deformation twins beneath the indent. (e) TEM dark-field image of the region represented by a dashed blue rectangle in (a) showing the morphologies of deformation twins.](/cms/asset/6294cc59-87a6-461e-b0d9-75f78fbeebe4/tmrl_a_2380101_f0004_oc.jpg)
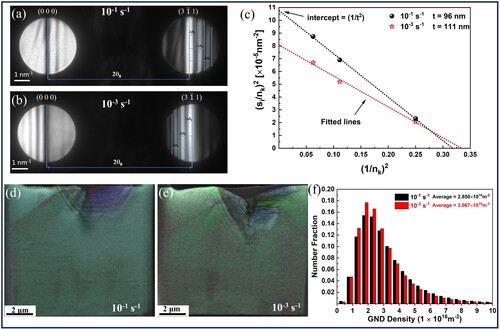
Figure 5. KM fringes in CBED patterns under a two-beam condition with strongly excited for TEM lamellae of the indents at the strain rates of (a) 10−1 and (b) 10−3 s−1; (c) plot of (si/nk)2 against (1/nk)2, TEM foil thicknesses for (a) and (b) are extrapolated to be 96 and 111 nm from the intercepts of (1/t)2, respectively (Details can be found in Section 3 of Supplementary Materials). t-EBSD IPF overlapped with image quality maps of the TEM lamellae of the indents at the strain rates of (d) 10−1 and (e) 10−3 s−1; (f) corresponding statistical histograms of the GND densities of (d) and (e).