
Figures & data
Table 1. Nominal and actual chemical compositions of the studied Ti-8Mo-6Zr-6Sn-(0–5)Al (wt%) alloys.
Figure 1. XRD patterns (a), DSC curves (b) and loading-unlading stress-strain curves (c) of the TMZSA specimens solid-solution treated at 900°C for 30 min. The red dashed lines with arrows below the stress-strain curves in (c) represent the recovery strain due to the shape memory effect.
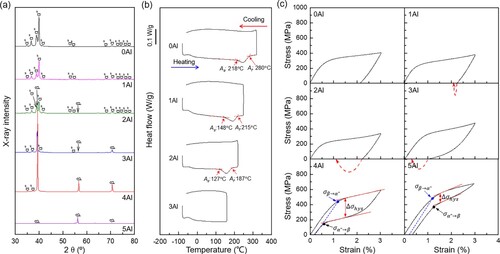
Figure 2. Comparison maps of stress hysteresis () vs
(a) and stress hysteresis (
) vs alloying element content (b) of 4Al and 5Al alloy specimens in the present study and other typical superelastic Ni-free Ti-Nb-, Ti-Zr(-Hf)- and Ti-Mo-based shape memory alloys subjected to solid-solution treatment (ST), annealing (AN) or aging treatment (AG) [Citation2–4,Citation11,Citation14,Citation16–39]. The
represents the critical stress for inducing β → α″ martensitic transformation. Alloy compositions in at% in alloys are converted to wt% in (b) for comparison. The red arrows in (a) represent the desired properties of narrow stress hysteresis and high yield strength (
) and those in (b) represent the desired alloys with low content of alloying elements and narrow stress hysteresis.
![Figure 2. Comparison maps of stress hysteresis (Δσhys) vs σβ→α″ (a) and stress hysteresis (Δσhys) vs alloying element content (b) of 4Al and 5Al alloy specimens in the present study and other typical superelastic Ni-free Ti-Nb-, Ti-Zr(-Hf)- and Ti-Mo-based shape memory alloys subjected to solid-solution treatment (ST), annealing (AN) or aging treatment (AG) [Citation2–4,Citation11,Citation14,Citation16–39]. The σβ→α″ represents the critical stress for inducing β → α″ martensitic transformation. Alloy compositions in at% in alloys are converted to wt% in (b) for comparison. The red arrows in (a) represent the desired properties of narrow stress hysteresis and high yield strength (σβ→α″) and those in (b) represent the desired alloys with low content of alloying elements and narrow stress hysteresis.](/cms/asset/ed4787dc-fe04-46d8-9186-e9e2c2474c03/tmrl_a_2382750_f0002_oc.jpg)
Figure 3. Cyclic loading-unloading stress-strain curves obtained at room temperature of the 4Al (a) and 5Al (b) alloy specimens solid-solution treated at 900°C for 30 min. The applied strain of the first cycle is set as 1.5% and is increased by 0.5% in each following cycle. (c) The plot of recovery strain () as a function of the applied strain of 4Al and 5Al alloy specimens in the present study and other typical superelastic Ni-free Ti-Mo-based shape memory alloys subjected to solid-solution treatment (ST), annealing (AN) or aging treatment (AG) [Citation4,Citation5,Citation16–18,Citation38,Citation39].
![Figure 3. Cyclic loading-unloading stress-strain curves obtained at room temperature of the 4Al (a) and 5Al (b) alloy specimens solid-solution treated at 900°C for 30 min. The applied strain of the first cycle is set as 1.5% and is increased by 0.5% in each following cycle. (c) The plot of recovery strain (ϵr) as a function of the applied strain of 4Al and 5Al alloy specimens in the present study and other typical superelastic Ni-free Ti-Mo-based shape memory alloys subjected to solid-solution treatment (ST), annealing (AN) or aging treatment (AG) [Citation4,Citation5,Citation16–18,Citation38,Citation39].](/cms/asset/42bdf7a8-12b2-48ae-8b91-5e2722a16680/tmrl_a_2382750_f0003_oc.jpg)
Table 2. Comparison of ,
and
measured by cyclic loading-unloading tensile tests of Ti-8Mo-6Zr-6Sn-(4, 5)Al and typical superelastic Ni-free Ti-Nb, Ti-Zr and Ti-Mo-based shape memory alloys subjected to solid-solution treatment or aging treatment for biomedical applications.
Figure 4. Selected-area diffraction patterns and the corresponding dark-field TEM images taken by the circled diffraction spots for the 4Al (a, a-1) and 5Al (b, b-1) alloy specimens solid-solution treated at 900°C for 30 min.
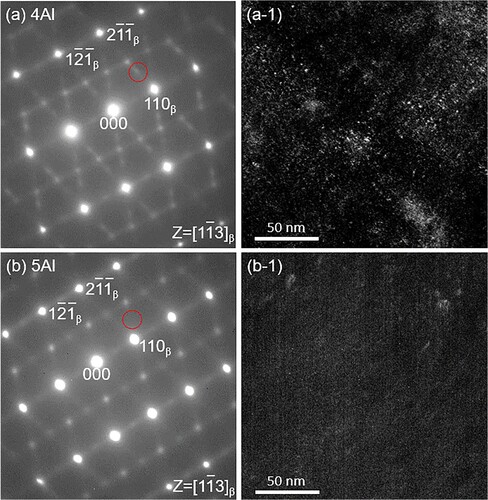
Figure 5. A schematic diagram showing the Al content dependence of : (a) β matrix without
, (b) β matrix with
adapted from Refs. [Citation2,Citation9].
![Figure 5. A schematic diagram showing the Al content dependence of σβ→α″: (a) β matrix without ωath, (b) β matrix with ωath adapted from Refs. [Citation2,Citation9].](/cms/asset/efe1a8bf-49dc-4f9d-9f04-29cdf3a7482a/tmrl_a_2382750_f0005_oc.jpg)