Figures & data
Figure 1. Number of publications from each journal from 2013 to 2021 (Note: Web of Science has only indexed Journalism Practice since 2015).
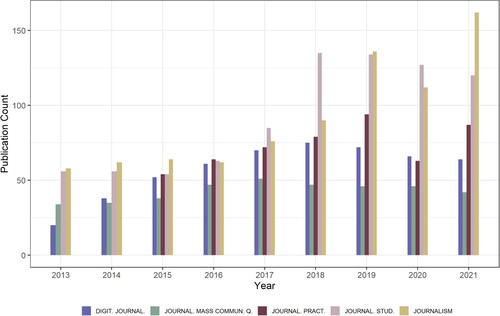
Table 1. Dictionary entries used to detect quantitative and computational approaches in abstracts.
Figure 2. Diversity indices of all included journalism journals (pink) and Digital Journalism (purple) according to country (author), detected country (content), detected gender (author), detected quantitative methods, and detected computational methods.
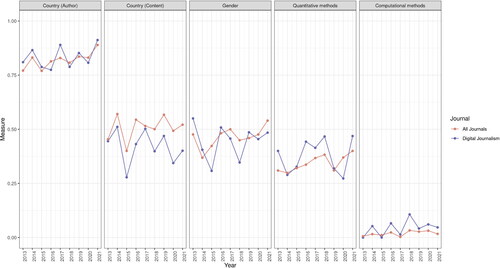
Figure 3. International diversity at the author level (top left: all five journals, top right: Digital Journalism) and content level (bottom left: all five journals, bottom right: Digital Journalism).
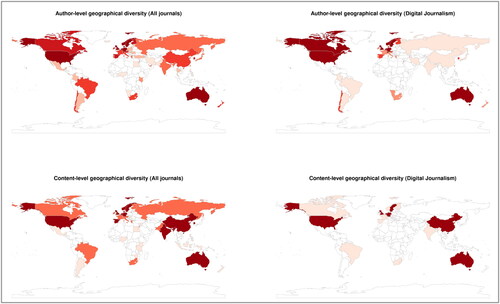
Table 2. The top 15 most represented countries in the five journals’ authorship.
Table 3. The top 10 most represented countries for each journal.
Figure 4. Gender distribution in the top 20 countries with the most contributions to publications (left) and global regions based on the United Nations’ grouping of states (right).
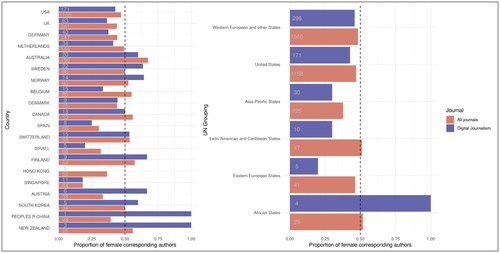
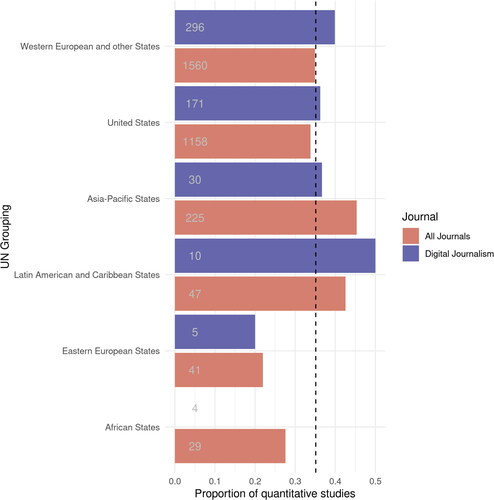
Figure 5. Proportion of quantitative studies across six regions. Countries are grouped based on the United Nations’ categorisation of states. The dotted line shows the group average: 35.1%.