
Figures & data
Table 1 Demographic characteristics among US adults with ALS who responded to the National ALS Registry’s Clinical Survey Module (19 October 2010–31 December 2015).
Table 2 Initial site of onset among 1758Table Footnotea US adults with ALS who responded to the National ALS Registry’s Clinical Survey Module (19 October 2010–31 December 2015).
Table 3 Other symptoms experienced among 1758Table Footnotea US adults with ALS who responded to the National ALS Registry’s Clinical Survey Module (19 October 2010–31 December 2015).
Figure 1 Median time from ALS diagnosis to symptoms onset among adults with ALS, 19 October 2010–31 December 2015.
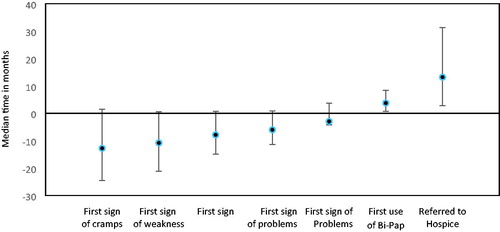
Figure 2 Median time from ALS diagnosis to symptoms onset stratified on body part weakness among adults with ALS, 19 October 2010–31 December 2015.
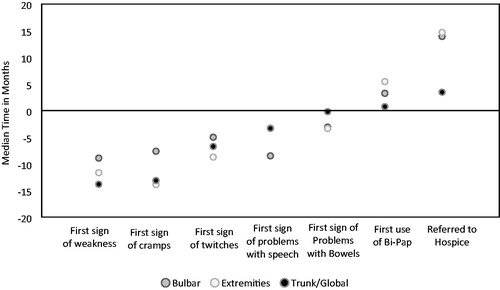
Table 4 Use of Interventions among 1758Table Footnotea US Adults with ALS who responded to the National ALS Registry’s Clinical Survey Module (19 October 2010–31 December 2015).