Figures & data
Figure 1 Center variability in the prevalence of a 5-point or greater increase in ALSFRS-R total score. Raw 12-month ALSFRS-R data from the 36 trial centers with the largest number of enrolled patients in the dexpramipexole trial. Per center, the number of patients with a 5-point or more increase in ALSFRS-R total score are highlighted in red. The percentage per center indicates the proportion of patients with an increase, which ranges from 0% to 83%.
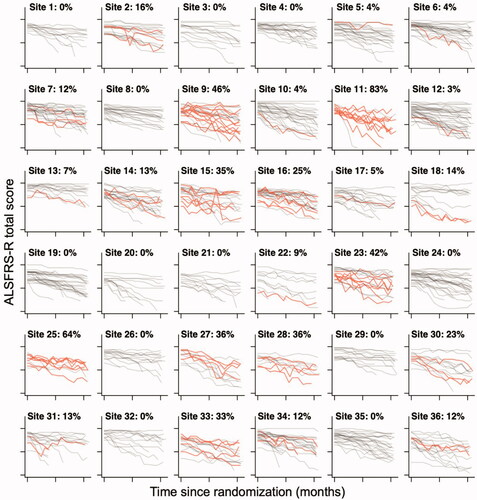
Figure 2 Probability of observing the number of patients with a 5-point or more increase per trial center. To distinguish the variability in prevalence between centers from random noise and potential underperformance of a particular center, for each center we calculated the probability of observing a particular number of patients with a 5-point or more increase (cases) out of the total number of patients enrolled in that center, given the average background prevalence observed in other trial centers. Centers with a probability less than 5% (dotted line) were flagged as potential outliers.
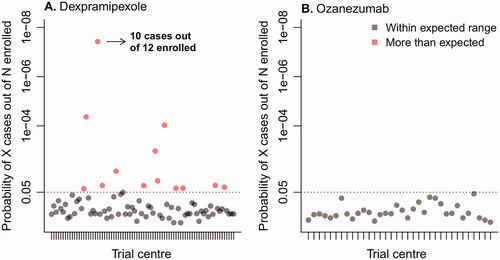
Figure 3 Number of enrolled patients vs. prevalence of sudden 5-point or more increase. Relationship between the number of enrolled patients per trial center who participated during the dexpramipexole trial, and their association with the prevalence of a sudden 5-point or more increase. Darker dots represent overlapping centers. Solid line: regression line estimate with 95% confidence interval. Dashed line: average prevalence in the dexpramipexole trial. OR: odds ratio; CI: confidence interval; No: number.
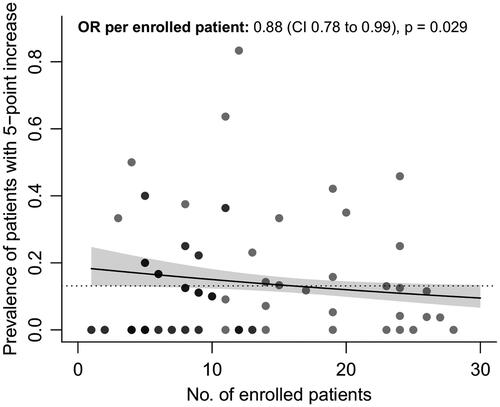
Table 1 Baseline characteristics of patients with and without a 5-point or more increase in ALSFRS-R total score.
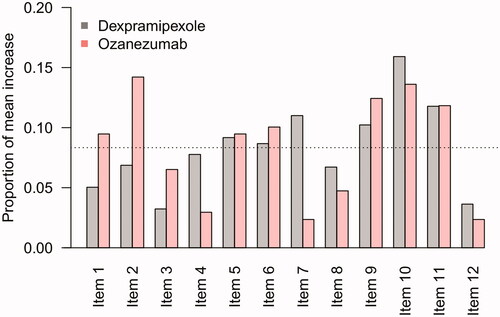
Figure 4 Contribution of individual items to a sudden 5-point or more increase. Mean, proportional contribution of individual ALSFRS-R items to a sudden 5-point or more increase. For example, in the dexpramipexole trial, there were 123 patients with a 5-point or more increase during follow-up with a mean increase in total score of 6.3 points, of which 0.3 points (5%) were due to an increase in Item 1. If each item was equally responsible for the mean increase in total score, one would expect that each item would be accountable for 1/12 (8.3%, dashed line).