
Figures & data
Table 1 Demographic and disease-related characteristics of the participants.
Figure 1 Per-item frequencies for enacted stigma among patients (N = 193).
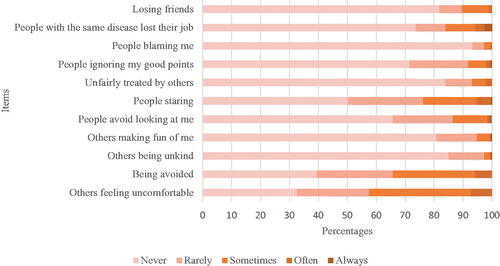
Figure 2 Per-item frequencies for enacted stigma among caregivers (N = 87).
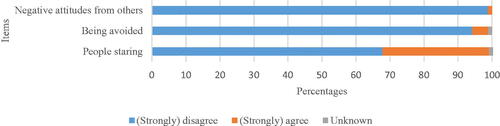
Table 2 Manifestations of enacted stigma identified from the interviews.
Figure 3 Per-item frequencies for felt stigma among patients (N = 193).
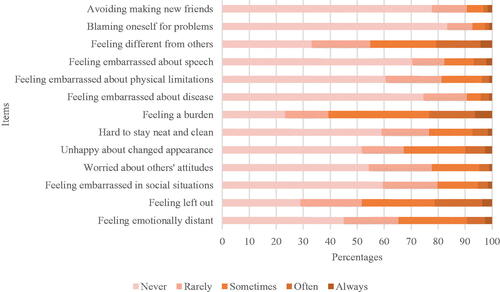
Figure 4 Per-item frequencies for felt stigma among caregivers (N = 87).
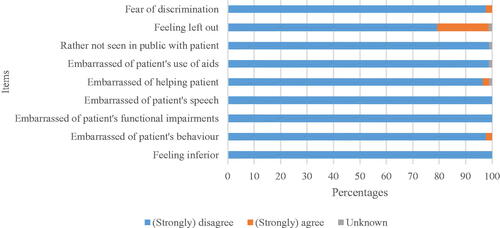
Table 3 Manifestations of felt stigma identified from the interviews.
Table 4 Responses to stigma identified from the interviews.
Table 5 Outcomes of multivariable regression models assessing associated factors of enacted and felt stigma among patients (N = 193).
Data availability statement
The data that support the findings of this study are available from the corresponding author, MSS, upon reasonable request.