Figures & data
Figure 1. In silico analysis of the effect of mutation at position I149S of SOD1 predicts lower aggregation propensity but greater instability. (A) Side and bottom views of the SOD1 monomer structure showing residue I149 as spheres (blue) oriented into the core of the beta-barrel. (B) Aggrescan 2D measurement of wild-type (WT; black) and I149S (blue) on the aggregation propensity of SOD1. (C) MAESTRO predicted folding stability changes of the mutants at position I149 in SOD1 and A4V, showing that mutation at I149 is predicted to be destabilizing.
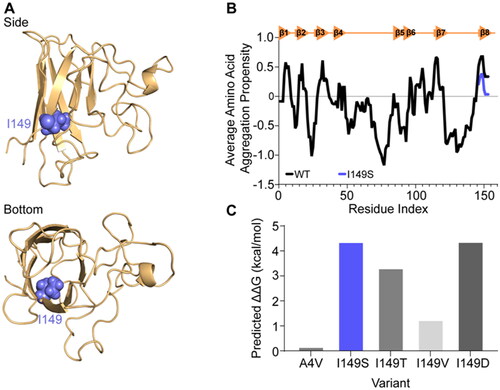
Figure 2. SOD1I149S forms inclusions and decreases the viability of motor neuron-like cells. (A) Example images of NSC-34 cells expressing GFP-tagged SOD1 variants. Arrows point to cells containing inclusions. Scale bar = 50 µm. (B) The percentage of cells containing inclusions within the top 10% highest expressing cells, showing the I149S readily forms inclusions. (C) Enumeration of GFP + cells 24, 48, and 72 h post-transfection normalized to 24 h and wild-type counts, showing that cells expressing I149S (blue) decrease over time. (D) Quantification of the 72 h time point from panel C, showing that at 72 h, SOD1-I149S expressing cells are at 40% the number of cells expressing SOD1-WT. Error bars represent SD from at least 3 biological replicates. Significance determined by One-way ANOVA with Tukey’s post test. **** = p < 0.0001, *** = p < 0.001, and ** = p < 0.01.
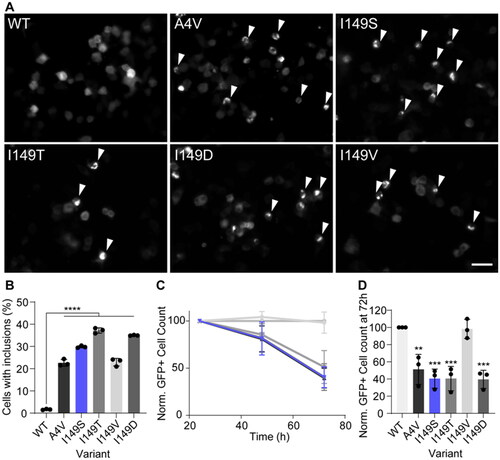
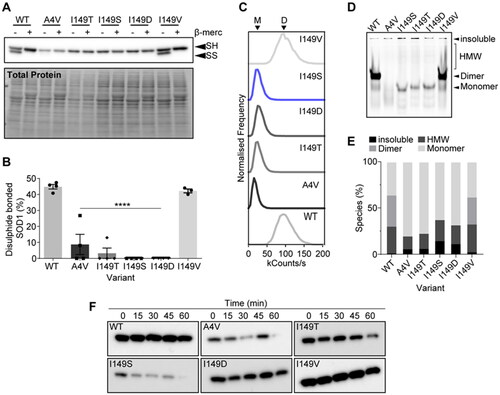
Figure 3. SOD1I149S destabilizes the intramolecular disulphide and decreases dimer formation. (A) Immunoblotting for disulphide bonded SOD1 was carried out by running non-reducing SDS-PAGE, where faster migrating bands (SS) are disulphide bonded SOD1 and slower migrating bands (SH) are disulphide reduced SOD1. (B) Quantification of the percentage of SOD1 that was disulphide bonded showing that SOD1I149S was completely reduced. (C) Brightness histograms from fluorescence correlation spectroscopy showing that the average brightness of SOD1WT and SOD1I149V were higher than other variants, indicating these two variants are oligomeric. (D) Clear Native-PAGE of transfected cell lysates showing GFP signal where several species are observable (HMW = high molecular weight). Only SOD1WT and SOD1I149V showed any dimer signal. (E) Quantification of the percentage of each species present from clear Native-PAGE in panel (D). (F) Limited proteolysis of SOD1 variants using proteinase-K showed that the variants were differentially susceptible to proteolysis over 1 h. Error bars represent SD of the mean from 3 separate experiments. Significance determined with One-way ANOVA using Tukey’s post-hoc test (p < 0.0001 = ****).