Figures & data
Figure 1. Global green coffee bean production (t yr−1), 2010 to 2019 by country of origin (FAOSTAT Citation2019).
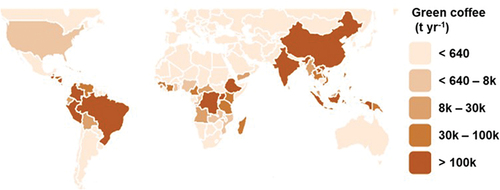
Figure 2. Systematic review process. *search strings: “climate change” and “adaptation” or “mitigation” or “management” and “coffee”.
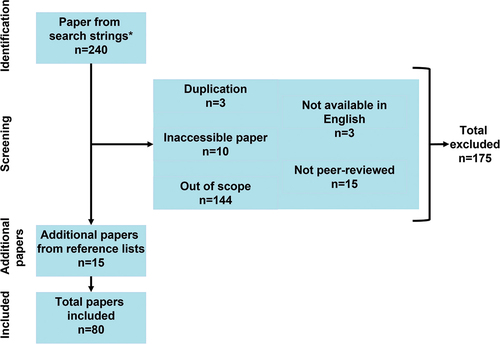
Figure 3. (a) Cumulative publications for selected coffee research themes between 2007 and 2021; (b) Total papers published focussing on key production regions or globally; (c) Total papers on Arabica and Robusta varieties.
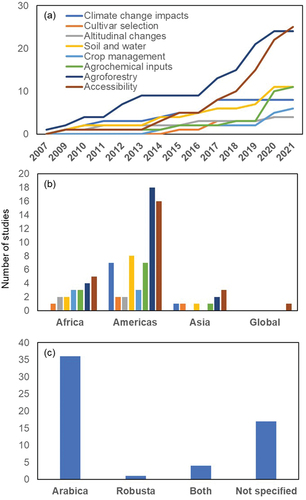
Figure 4. Climate change impacts on coffee production systems.
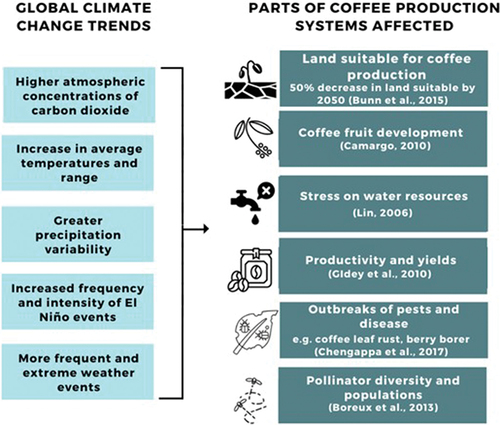
Table 1. Predicted decrease in land suitable for Arabica cultivation (%) for selection of leading coffee producers. Area harvested from FAOSTAT (Citation2019).
Figure 5. IUCN categorization of extinction risk to known coffee species. Critically endangered (CE), endangered (E), vulnerable (V), near-threatened (NT), least concern (LC), data not available (DA). Data from (Davis et al. Citation2019).
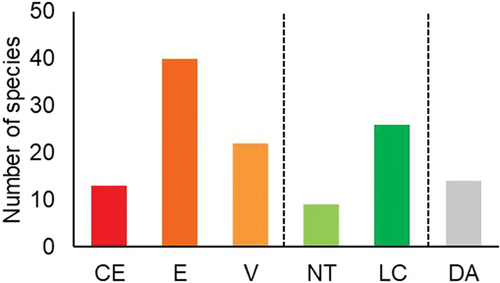
Table 2. Predicted altitudinal changes in land suitability for growing Arabica for a selection of leading coffee producing countries.
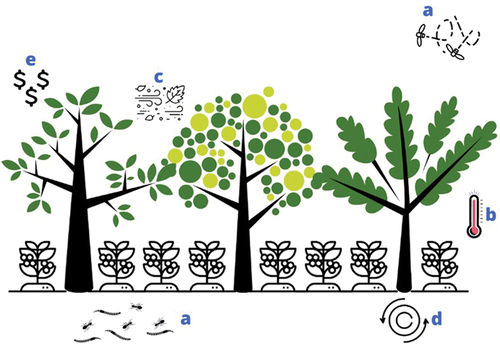
Figure 6. Potential integrated ecological and economic benefits from agroforestry for coffee production including increased (a) above and below ground species biodiversity; (b) temperature stabilization; (c); wind speed reduction; (d) carbon storage; (e) diversified income from non-timber products(.