Figures & data
Figure 1. (a) Schematic representation of the CP unit. A single layer of cuboidal epithelial cells is folded into numerous small villi, each with a fluid-filled core of connective tissue richly supplied by blood vessels. Adapted from Oreskovic,Citation3 with permission. (b) Compartments of the CP with chemical equilibria and unidirectional rate constants defined per text. Volumes shown do not reflect relative volume fraction. This illustration is elaborated further in .
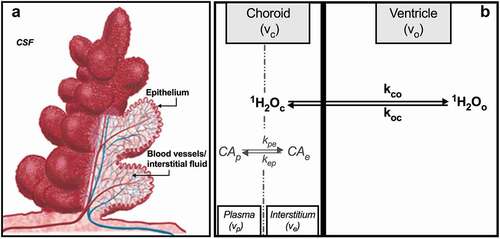
Figure 2. General mechanisms of CP steady-state water exchange. Most water flux at the CP (shown here with unidirectional rate constants kco and koc) is synchronized to the kinetics of NKA-dependent exchange of Na+ and K+ ions at the apical cell membrane (red rectangle). Pathways I–IV describe secondary active processes contributing to water, Na+ and K+ transport (blue, green and brown arrows, respectively) into or out of the cell. These include, but are not limited to, substrate (e.g., Na+, K+, Cl−, glucose) coupled co-transport of water at the apical (i) and basolateral (IV) membranes, potassium channels (II), some of which are voltage-gated (KCC4, Kv1.1, Kv1.4, Kir7.1), and Na+-coupled bicarbonate transporters (III) (e.g., NCBE, NBCe2).Citation8 The arrow size of pathways I–IV is meant to convey the relative contribution of each to the overall flux, but is not quantitatively to scale. Paracellular transport, via claudin-2 pores or ependymal drainage of interstitial fluid, also contributes to water and ion fluxes, but likely represents a relatively minor contribution.Citation6 These routes (olive arrow) are indicated with a δ.
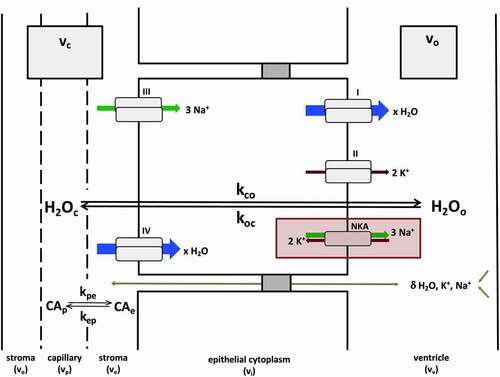
Table 1. Demographic and clinical characteristicsa
Figure 3. Image processing. (a) Brain-extracted high-resolution T1-w GRE and FLAIR images were bias field corrected, co-registered and brought into PD space. (b) Dynamic FLASH volumes were first registered to the image at the temporal center of the acquisition. In a second step, this skull-stripped, bias-corrected image was registered to the PD image and the transform applied to each volume in the FLASH series. (c) A representative R1(t) map, prepared by fitting dynamic FLASH volumes to the GRE signal intensity equation (shown in rectangle). Insets: R1 maps of the posterior horn (outlined in yellow) before (upper) and 52 seconds after (lower) CA injection. CP-containing voxels show a clear R1 increase after CA arrival.
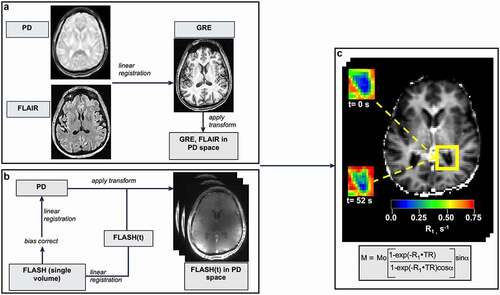
Figure 4. Representative CP R1(t) behavior. (a) Time-course of CP ROI (19 voxels; 0.38 mL) R1 values after CA injection in a 64 year-old CN subject. R1 map (upper left) shows the ROI (red) from which data were obtained. R1 values in the sagittal sinus (R1b) are plotted at upper right. (b) Time-course of R1 changes (ΔR1) in the CP (∙) and CSF (o) after CA arrival. Plasma CA concentration, [CAp], is shown along the upper axis. Inset: R1 map. Arrow shows the ROI from which CSF R1 values were measured. (c) Fittings of SSM (_, EquationEqn. [1(1)
(1) ]) and SM (– -, EquationEqns. [2]
(2)
(2) and Equation[3
(3)
(3) ]) models to the CP R1 time-course from a 77 year-old CI subject. Insets: Residual plots from SSM (upper) and SM (lower) model fittings. Note the randomness and constant spread of residuals about the horizontal y = 0 line and more negative minimum of the AIC in the SSM fitting.
![Figure 4. Representative CP R1(t) behavior. (a) Time-course of CP ROI (19 voxels; 0.38 mL) R1 values after CA injection in a 64 year-old CN subject. R1 map (upper left) shows the ROI (red) from which data were obtained. R1 values in the sagittal sinus (R1b) are plotted at upper right. (b) Time-course of R1 changes (ΔR1) in the CP (∙) and CSF (o) after CA arrival. Plasma CA concentration, [CAp], is shown along the upper axis. Inset: R1 map. Arrow shows the ROI from which CSF R1 values were measured. (c) Fittings of SSM (_, EquationEqn. [1(1) R1t=12R1o0+[CAc]+R1c0+kco+kcovc1−vc−12R1o0−r1c[CAc]−R1c0−kcokcovc1−vc2+4kco2vc1−vc1/2(1) ]) and SM (– -, EquationEqns. [2](2) CAc(t)=Ktransve−1∫0T[CAp](t)e−Ktransve−1(T−t)dt(2) and Equation[3(3) R1bt − r1b(1−h)[CAp]+R1b0(3) ]) models to the CP R1 time-course from a 77 year-old CI subject. Insets: Residual plots from SSM (upper) and SM (lower) model fittings. Note the randomness and constant spread of residuals about the horizontal y = 0 line and more negative minimum of the AIC in the SSM fitting.](/cms/asset/a5d28050-f854-4ada-8b5c-7247b2fabefa/ktib_a_1963143_f0004_oc.jpg)
Table 2. CP pharmacokinetic estimates
Figure 5. Estimate correlates. (a) Linear regression plots of individual ROI estimates of kco (↑ upper) and Ktrans (◊, lower) by age. Error bars, not all of which are visible on the scale of the plots, reflect SD. (b-d) Plots of mean kco and Ktrans values by neuropsychological test score in CN (filled) and CI (open) individuals. WMS-R Logical Memory II (b) tests verbal recall of a short story after a 30-minute delay. The score is the number of story units recalled, ranging from 0 to 25. The category fluency task (c) requires subjects to name as many unique animals as possible within 1 minute. The SDMT (d) requires subjects to match symbols to numbers according to a provided key. The score is the number of correct matches made in 90 sec. R2, F statistic and p (group) from age-adjusted linear regression analyses are shown.