Figures & data
Figure 1. Effect of P.g AuNPs on viability of RAW 264.7 cells. Cells were treated with P.g AuNPs at various concentrations (0, 1, 10, 100, and 200 μg/ml) for 24 h. Cell viability was measured by MTT assay.
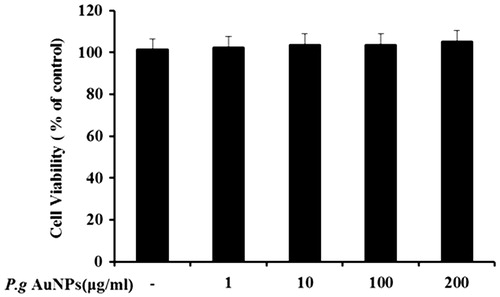
Figure 2. Effects of P.g AuNPs on LPS-induced expression of nitric oxide (NO) production and inducible NO synthase (iNOS) expression in RAW 264.7 cells. (A) NO release, (B) iNOS mRNA expression, (C) iNOS protein were measured in the culture medium of RAW 264.7 cells treated with 1 μg/ml LPS alone or with different concentrations of P.g AuNPs for 24 h. L-NMMA (50 μM) and BAY 11–7082 (10 μM) was used as a positive control drug for NO determination. Values shown are mean ± SEM of three independent experiments. *P < .05, **P < .01 and ***P < .001 versus LPS-treated cells.
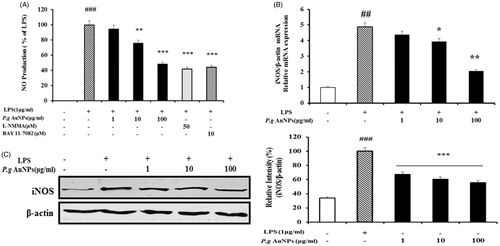
Figure 3. Effects of P.g AuNPs on LPS-induced expression of PGE2 production and Cyclooxygenase-2 (COX-2) expression in RAW 264.7 cells. (A) PGE2 production, (B) COX-2 mRNA expression, (C) COX-2 protein were measured in the culture medium of RAW 264.7 cells treated with 1 μg/ml LPS alone or with different concentrations of P.g AuNPs for 24 h. Values shown are mean ± SEM of three independent experiments. *P < .05, **P < .01, and ***P < .001 versus LPS-treated cells.
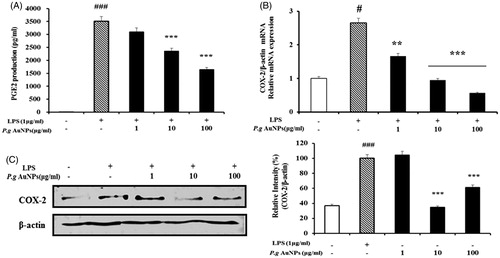
Figure 4. Effects of P.g AuNPs on LPS-induced expression of inflammation mediators in RAW 264.7 cells. (A) TNF-α production, (B) IL-6 production, (C) TNF-α mRNA expression, and (D) IL-6 mRNA expression. The mRNA expression data were normalized to the β-actin signal. Values shown are mean ± SEM of three independent experiments. *P < .05, **P < .01, and ***P < .001 versus LPS-treated cells.
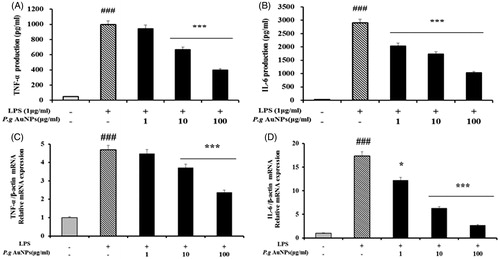
Figure 5. Effect of P.g AuNPs on activation of NF-κB signaling molecules and nuclear translocation of NF-κB. RAW 264.7 cells were pretreated with P.g AuNPs at the indicated concentration for 1 h and then exposed to LPS. Cytosolic proteins (phosphorylation of IKK α/β and IκB α/β) were prepared from RAW 264.7 cells and analyzed by Western blotting. Nuclear extracts were prepared from RAW 264.7 cells and analyzed by Western blotting using antibodies against NF-κB. Western blot analysis was independently repeated three times with similar results. *P < .05, **P < .01 and ***P < .001 versus LPS-treated cells.
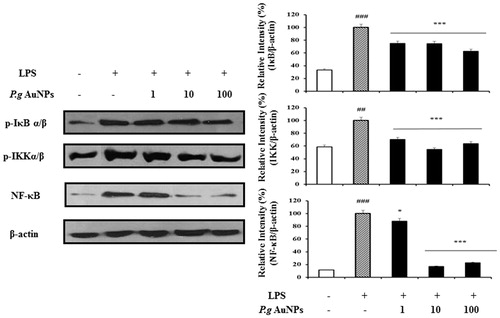
Figure 6. Effect of ginsenoside P.g AuNPs on LPS-induced phosphorylation of MAPKs in RAW 264.7 cells. Phosphorylation of mitogen-activated protein kinases was determined by Western blotting using a specific antibody against phosphorylated protein. *P < .05, **P < .01, and ***P < .001 versus LPS-treated cells.
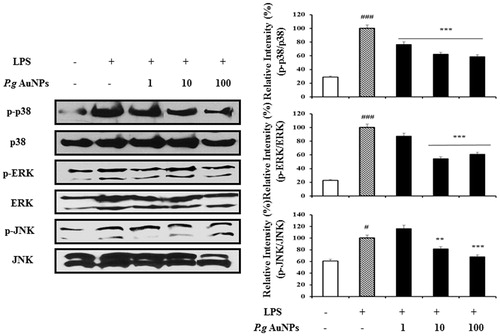
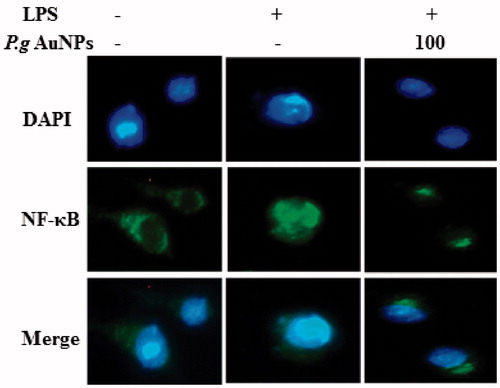
Figure 7. P.g AuNPs inhibited the nuclear translocation of NF-κB induced by LPS in RAW 264.7 cells. Cells were incubated with or without 100 μg/ml ginsenoside P.g AuNPs for 1 h and then stimulated with LPS (1 μg/ml) for 30 min. Cells were stained with rabbit anti-NF-κB p65, followed by Alexa Fluor1488 goat anti-rabbit IgG as a secondary antibody. Nuclei were identified using DAPI. Data are representative of three independent experiments.