
Figures & data
Figure 1. Powder XRD pattern of (a) ZnO (LA), (b) ZnO (AI-1), (c) ZnO (AI-2), (d) ZnO (AI-3), (e) ZnO (MA-1), (f) ZnO (MA-2), (g) ZnO (MA-3), (h) ZnO (IT-1), (i) ZnO (IT-2) and (j) ZnO (IT-3).
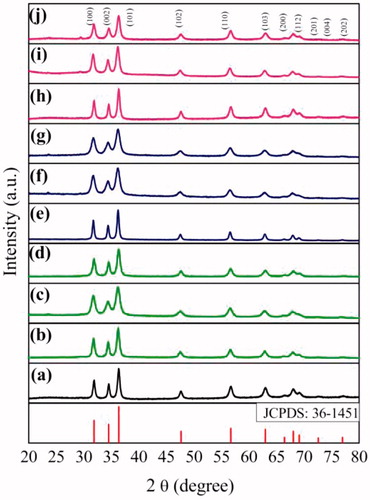
Table 1. Average crystallite size of ZnO NPs.
Figure 2. SEM images of (a) ZnO (LA), (b) ZnO (AI-2), (c) ZnO (MA-2) and (d) ZnO (IT-2).
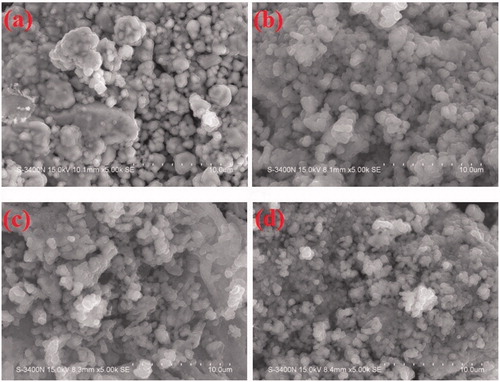
Figure 3. TEM images of (a) ZnO (LA), (b) ZnO (AI-2), (c) ZnO (MA-2) and (d) ZnO (IT-2).
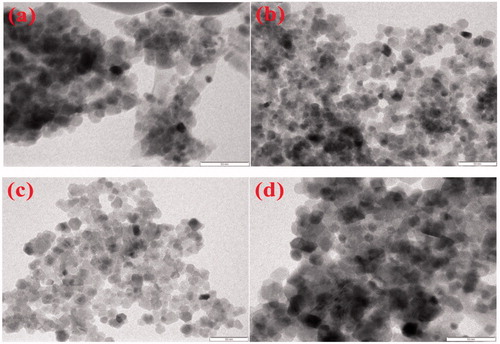
Figure 4. TG curves of (a) ZnO (LA), (b) ZnO (AI-2), (c) ZnO (MA-2) and (d) ZnO (IT-2).
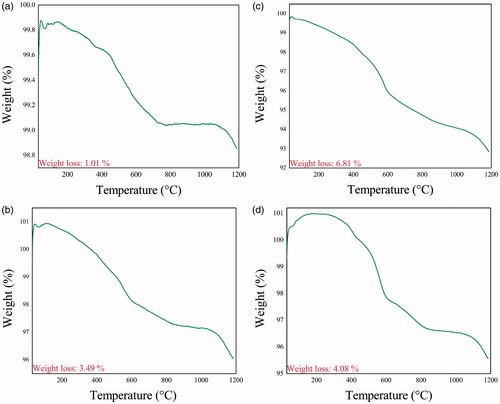
Table 2. BET surface area values of ZnO NPs.
Figure 5. Wide range XPS spectrum of (a) ZnO (LA), (b) ZnO (AI-2), (c) ZnO (MA-2) and (d) ZnO (IT-2).
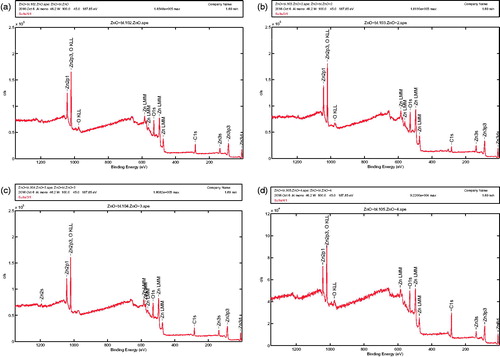
Table 3. Results of phytochemical screening of the aqueous leaf extracts of A. indicum, M. azedarach and I. tinctoria.
Figure 6. GC-MS analysis of the leaf extracts of (a) A. Indicum, (b) M. azedarach and (c) I. tinctoria.
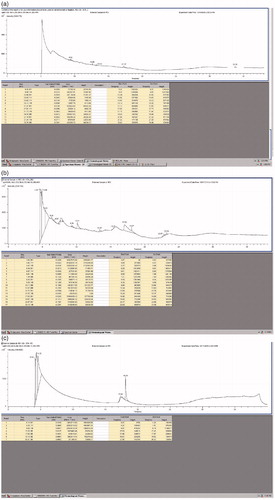
Table 4. Results of GC-MS analysis of the leaf extracts of A. indicum, M. azedarach and I. tinctoria.
Figure 7. Determination of IC50 values of (a) ZnO (LA), (b) ZnO (AI-2), (c) ZnO (MA-2) and (d) ZnO (IT-2) on DU-145 cell lines [data represent mean ± SD (standard deviation)].
![Figure 7. Determination of IC50 values of (a) ZnO (LA), (b) ZnO (AI-2), (c) ZnO (MA-2) and (d) ZnO (IT-2) on DU-145 cell lines [data represent mean ± SD (standard deviation)].](/cms/asset/0c4d2482-a0ae-487a-a592-0e98dc83bc78/ianb_a_1351982_f0007_c.jpg)
Figure 8. Determination of IC50 values of (a) ZnO (LA), (b) ZnO (AI-2), (c) ZnO (MA-2) and (d) ZnO (IT-2) on Calu-6 cell lines (data represent mean ± SD).
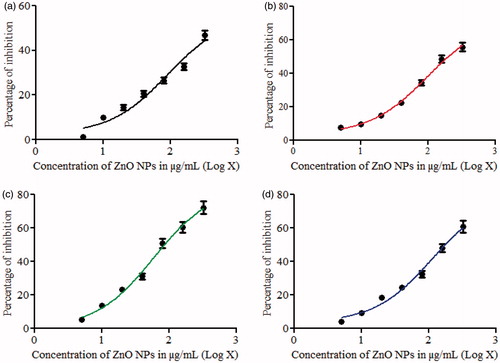
Table 5. IC50 (μg/mL) of ZnO NPs on DU-145 and Calu-6 cells.
Table 6. Haemolysis of blood by ZnO NPs.