Figures & data
Figure 1. Fibroblasts were cultured on chitosan-coated plates. (A) Optical and confocal microscopic live/dead staining images of fibroblast multicellular spheroids. Scale bar = 100 μm. (B) SA β-gal staining images of cells. Scale bar = 200 μm. (C) The percentages of cells stained by SA β-gal. N/A means no attached cells could be counted. (D). BrdU incorporation assay of cells (n = 4). #p < .05 and ##p < .01 mean that these groups were compared to the w/o treatment group. *p < .05.
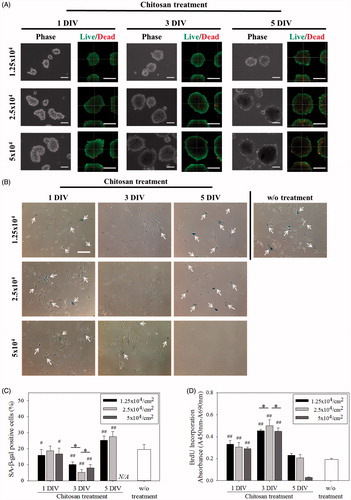
Table 1. Diameters of fibroblast multicellular spheroids on chitosan-coated plates during 5-day cultured period. Unit: μm.
Figure 2. Fibroblasts were cultured on PVA and pHEMA-coated plates. (A) Optical images of multicellular spheroids on PVA and pHEMA. Scale bar = 100 μm. (B) Viability of cells within the multicellular spheroids on chitosan, PVA and pHEMA determined by PI/annexin-V-FITC labeling. (C) SA β-gal staining images of biomaterial treatment cells. Scale bar = 200 μm. (D) The percentages of biomaterial treatment cells stained by SA β-gal. (E) BrdU incorporation assay of biomaterial treatment cells (n = 4). **p < .01.
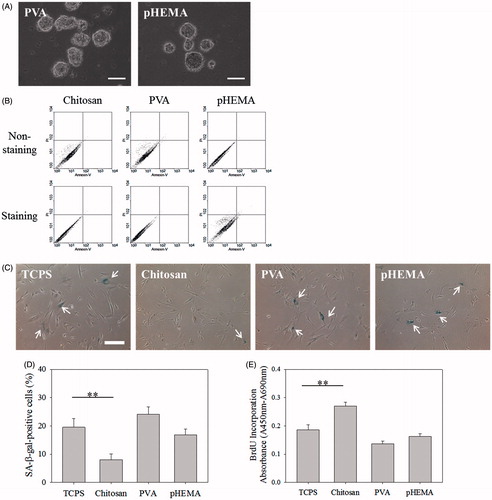
Figure 3. Senescence-related protein expression of fibroblasts on biomaterials. (A) Western blot results of p53, p16, p21, and pRB expressions in cells. (B) The relative amount of p53, p16, p21, and pRB protein expressions in cells (n > 3). #p < .05 and ##p < .01 mean these groups were compared to the TCPS groups. *p < .05, **p < .01.
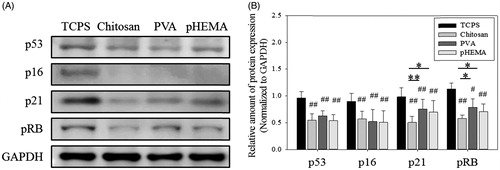
Figure 4. TGF-β pathway protein expression of fibroblasts on biomaterials. (A) Western blot results of TGF-β, Smad2/3 and pSmad2/3 expressions in cells. (B) The relative amount of TGF-β, Smad2/3 and pSmad2/3 protein expressions in cells (n > 3). ##p < .01 means these groups were compared to the TCPS groups. (C) Human TGF-β concentration of the medium which cells were cultured for 3 days (n = 3). *p < .05.
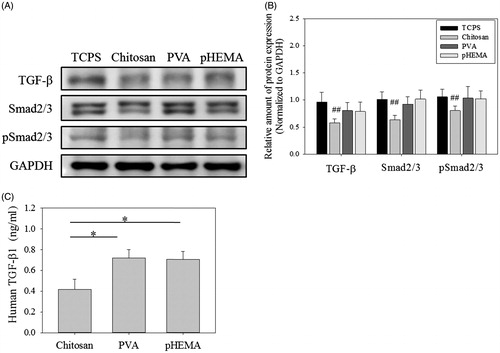
Figure 5. Soluble-form chitosan directly added into cells cultured on TCPS, PVA and pHEMA-coated plates. (A) SA β-gal staining images of cells cultured on TCPS. Scale bar =200 μm. (B) The percentages of cells cultured on TCPS stained by SA β-gal. (C) BrdU incorporation assay of cells cultured on TCPS (n = 4). (D) SA β-gal staining images of cells cultured on PVA and pHEMA. Scale bar = 200 μm. (E) The percentages of cells cultured on PVA and pHEMA stained by SA β-gal. The concentration of chitosan in the medium was 100 μg/ml. (F) BrdU incorporation assay of cells cultured on PVA and pHEMA (n = 4). The concentration of chitosan in the medium was 100 μg/ml. (G) Western blot results of TGF-β expressions in cells. (H) The relative amount of TGF-β protein expressions in cells (n > 3). *p < .05, **p < .01.
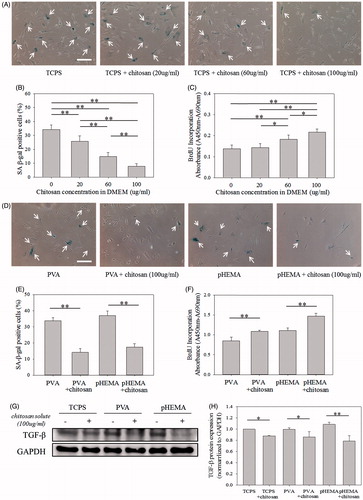
Figure 6. Soluble-form PVA and pHEMA (100 µg/ml) directly added into cells cultured on TCPS. (A) SA β-gal staining images of cells. Scale bar = 200 μm. (B) The percentages of cells stained by SA β-gal. (C) BrdU incorporation assay of cells (n = 4).
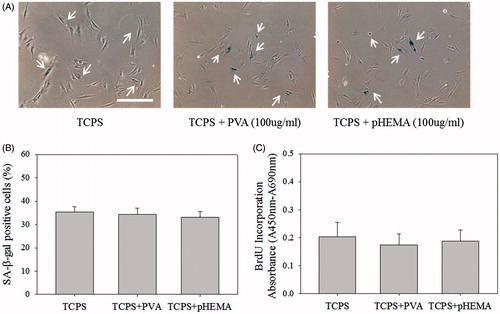
Figure 7. Interaction between chitosan and TGF-β. (A) Western blot results of TGF-β expression. First lane was 25 μg PD50 cell lysis protein only, second land was the supernatant which was collected from 25 μg PD50 cell lysis protein adding into 0.5% chitosan solution, and third land was 0.5% chitosan solution only. (B) SA β-gal staining images of cells. Scale bar = 200 μm. Changing substrate group means that the chitosan-coated substrate was changed every day within the 3-day culture. (C) The percentages of cells stained by SA β-gal. (D) BrdU incorporation assay of cells (n = 4). **p < .01. (E) The diagram of chitosan affecting senescent-related pathways.
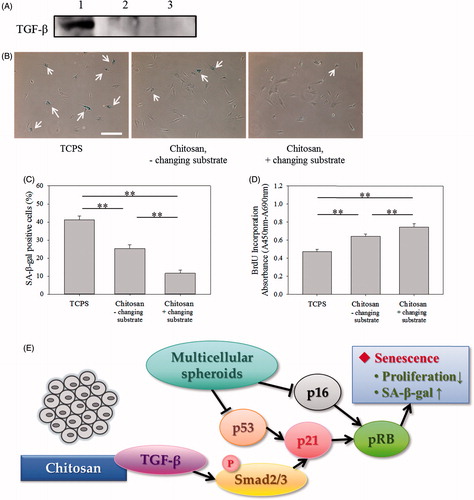
Figure 8. Effect of DDA of chitosan on senescence of fibroblasts. (A) SA β-gal staining images of cells cultured on 77% DDA, 85% DDA and 90% DDA chitosan-coated plates. Scale bar = 200 μm. (B) The percentages of cells cultured on different DDA chitosan-coated plates stained by SA β-gal. (C) BrdU incorporation assay of cells cultured on different DDA chitosan-coated plates (n = 4). **p < .01.
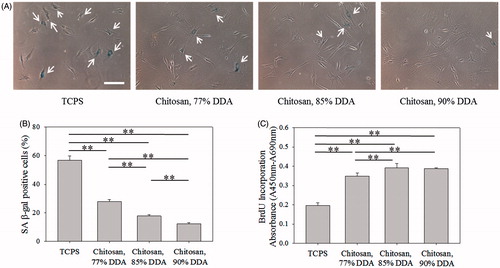
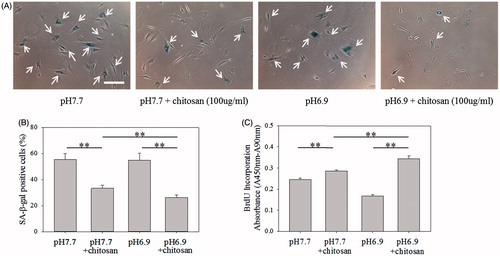
Figure 9. Effect of medium pH on senescence of fibroblasts. (A) SA β-gal staining images of cells cultured in different cultured medium pH. Scale bar = 200 μm. (B) The percentages of cells stained by SA β-gal. (C) BrdU incorporation assay of cells (n = 4). The concentration of chitosan in the medium was 100 μg/ml. **p < .01.