Figures & data
Figure 1. miR-199a expression levels in collected tissues specimens. miR-199a expression levels were significantly lower in kidney cancer tissues than that in the non-cancerous tissues. *p < .05.
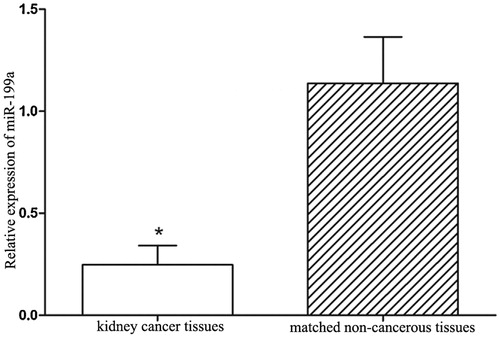
Table 1. Association between miR-199a expression and clinicopathological features in kidney cancer patients.
Figure 2. miR-199a suppresses renal cancer cell growth and metastasis. (A) Successful overexpression of miR-199a was confirmed by qRT-PCR after infection with miR-199a-expressing or vector control lentivirus. (B, C) Cell proliferation was measured by WST-1 assay at different time points. (D, E) Transwell migration and invasion assays. Representative images are shown in the left, and the quantification of 10 randomly selected fields is shown in the right. **p < .01.
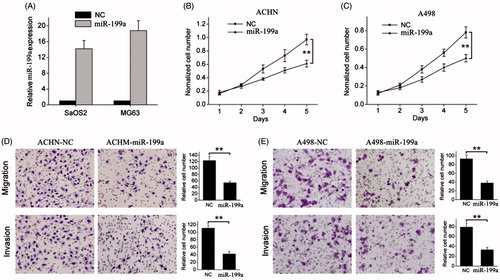
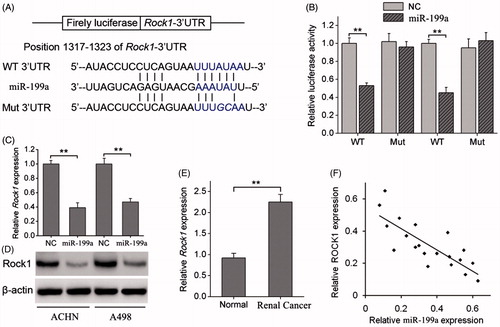
Figure 3. miR-199a negatively regulates ROCK1 by binding to the ROCK1 3′UTR. (A) Diagram of the ROCK1 3′UTR-containing reporter construct. Schematic representation of the miR-199a sequence, putative miR-199a targeting site in the 3′UTR of ROCK1, and the generated mutant ROCK1 3′UTR. (B) A luciferase reporter assay showed the inhibitory effect of miR-199a on ROCK1–3′UTR luciferase activity of ACHN and A498 cells. (C) ROCK1 mRNA levels were analysed by qRT-PCR in ACHN and A498 cells stably overexpressing miR-199a. (D) ROCK1 protein levels were analysed by Western blotting in ACHN and A498 stably overexpressing miR-199a. (E) Relative expression levels of ROCK1 in renal cancer tissues and adjacent normal tissues. (F) Correlation of ROCK1 expression to miR-199a expression in 20 renal cancer using simple linear regression analysis. **p < .01.