Figures & data
Figure 1. In vitro release of BMP6-derived peptide from Zein nanoparticles in trypsin containing PBS, pH 7.4. Error bars correspond to SD for n = 2
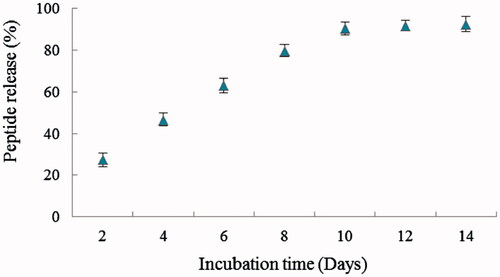
Figure 2. Representative particle size distribution and zeta potential of blank Zein nanoparticles (A, C) and peptide-loaded Zein nanoparticles (B, D), respectively.
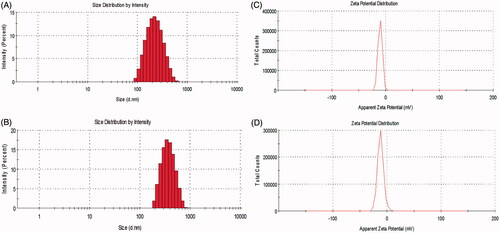
Figure 3. Electron microscopy images of blank Zein nanoparticles (A) and peptide-loaded Zein nanoparticles (B).
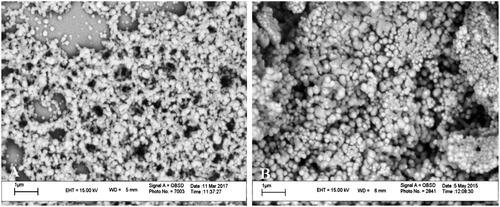
Figure 4. FTIR spectrum of bulk Zein powder, peptide-loaded and blank Zein nanoparticles.
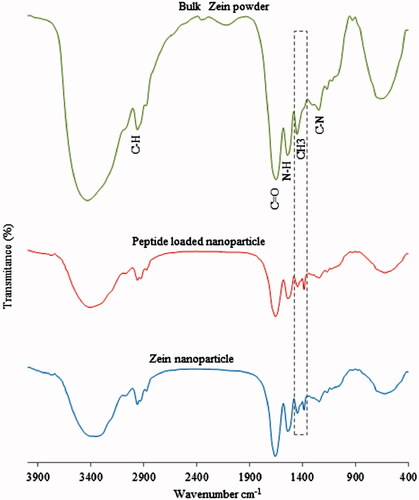
Figure 5. TGA of Zein blank (______) and peptide-loaded (….) nanoparticles.
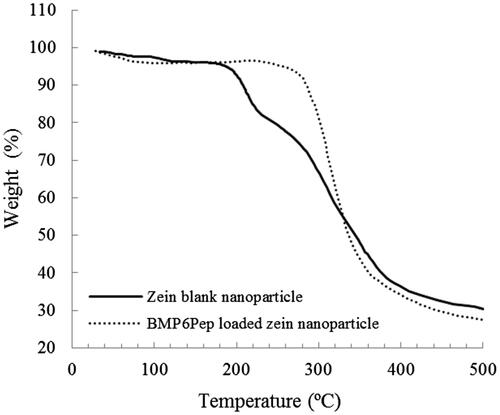
Figure 6. ALP activity in C2C12 cells at 7, 14, 21 and 28 days incubation. *Statistically significant difference (p < .05) between ALPase activity for a given time point. Error bars correspond to SD for n = 3.
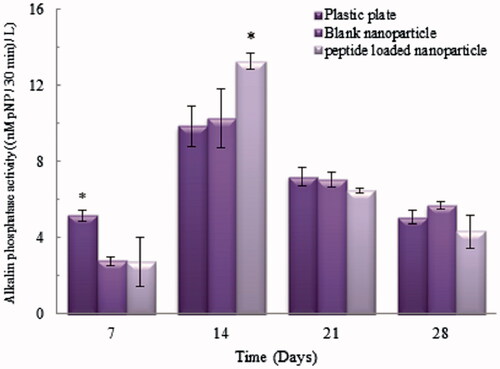
Figure 7. Optical microscope images of different samples after staining with Alizarin Red S on day 21 (A). The amount of Alizarin Red S that stained the mineralized matrix was quantified using the spectrophotometric method (B). Mineralization occurred in all groups, but C2C12 cell behind peptide-loaded nanoparticles has significantly higher calcium deposition. *,**Statistically significant difference (p < .05) and (p < .001) respectively for calcium deposition. Error bars correspond to SD for n = 3.
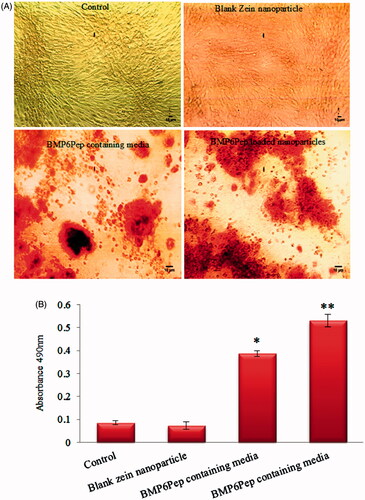
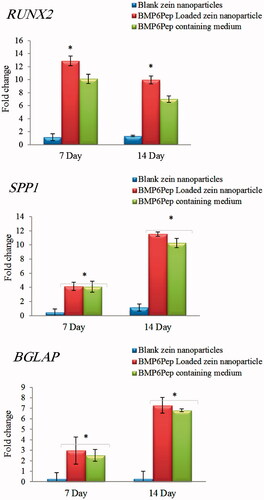
Figure 8. Osteogenesis-specific mRNA levels of RUNX, SPP1 and BGLAP marker genes, 7 and 14 days after incubation. The values are mean ± SD of independent experiments performed in triplicate. *p < .05 between gene expression for a given time point.