Figures & data
Table 1. Primer sequences for immunological genes in Drosophila.
Table 2. Primers for quantification of Drosophila microbiota.
Table 3. Primers for quantification of human microbiota.
Figure 1. Total phenolic, flavonoid and tannin constitution in Triphala extracts. Triphala extracts were made using water, water:HCl, methanol (MeOH), MeOH:HCl, ethanol (EtOH) or EtOH:HCl solutions as extract media. Total (a) phenolic, (b) flavonoid, (c) condensed tannin and (d) hydrolysable tannins were assessed using various colourimetric assays. Each group contained n = 3 independent trials while significant differences are indicated by *p < .05 and **p < .01 between groups.
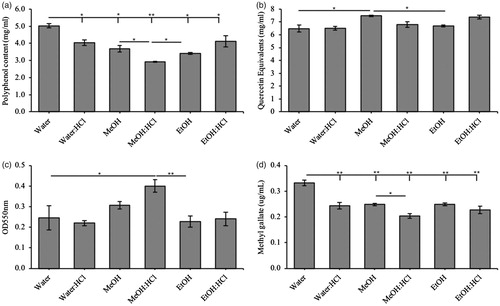
Figure 2. Characterization of the prebiotic activity of Triphala compared to known controls in both aerobic and anaerobic species. The prebiotic activity of Triphala was assessed in a variety of (a) aerobic and (b) anaerobic species using in vitro isolated cultures. Each bacterial strain was incubated in mMRS supplemented with either glucose (dark grey), inulin (light grey), scFOS (medium grey) or Triphala (black) as the only fermentable source of energy. Each group contained n = 5 independent samples and significance is indicated as *p < .05 and **p < .01 between groups.
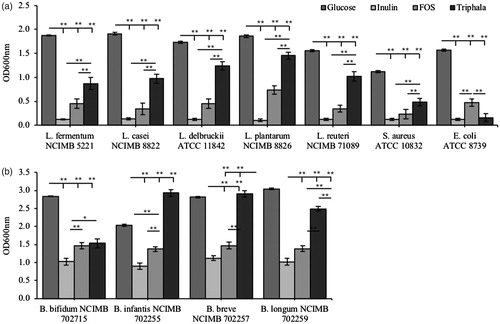
Figure 3. Toxicity of Triphala in Drosophila melanogaster. After eclosion, Drosophila were placed on media supplemented with different concentrations (0–2% w/v) of Triphala water extracts. A variety of physiological parameters were assessed including (a) average body weight, (b) motility through the negative geotaxis test and (c) longevity. All groups contained n = 5 independent samples and significance is indicated as *p < .05 and **p < .01.
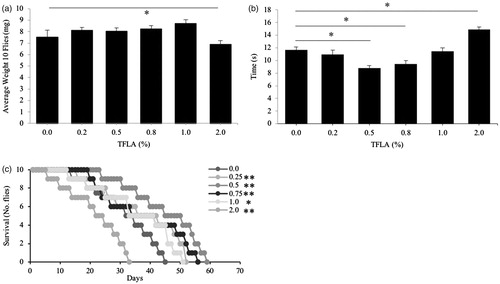
Figure 4. Triphala induces variations in Drosophila gut microbiota populations. After 14 days exposure to the various concentrations (0–2% w/v) of Triphala-treated media, quantification of the Drosophila gutx microbiota was assessed using real-time PCR. Each group contains n = 5 independent samples and significance is marked as *p < .05 relative to the 0% Triphala control.
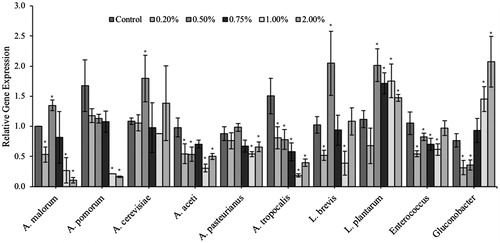
Figure 5. Triphala is not toxic to variations in weight in Drosophila melanogaster. After eclosion, Drosophila were exposed to media containing a dose-curve of the probiotic bacteria (a) L. plantarum NCIMB 8826 (Lp8826), (b) L. fermentum NCIMB 5221 (Lf5221) and (c) B. longum subsp. infantis NCIMB 702255 (Bi702255) and variations in the Drosophila’s total weight was recorded weekly from Day 0 to Day 56. Each group contained n = 5 independent samples and significance is marked as *p < .05 and **p < .01. Stars indicate significance relative to the normal-media control where bars indicate variations between groups.
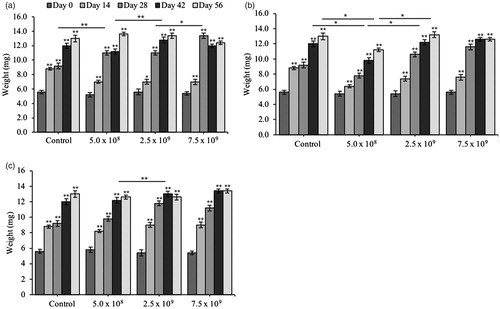
Table 4. Motility of Drosophila over time after exposure to various probiotic bacteria.
Table 5. Longevity of Drosophila fed various probiotic bacteria.
Figure 6. Probiotics are not recognized as invading pathogens in Drosophila melanogaster. To assess the immunoreactivity of Drosophila after immediate exposure to the probiotic bacteria, 5-day old Drosophila were transferred to media inoculated with various concentrations of Lf5221. After 1, 3, 6 and 12 h, samples of Drosophila were taken and the expression of the immunological genes (a) immune deficiency (IMD), (b) PGRP-LC-interacting inhibitor of IMD signalling (PIMS), (c) dual oxidase (Duox) and (d) defensin were assessed using real-time PCR. Each group contained n = 5 independent samples and significance is marked as *p < .05 and **p < .01. Stars indicate significance relative to the normal-media control where bars indicate variations between groups.
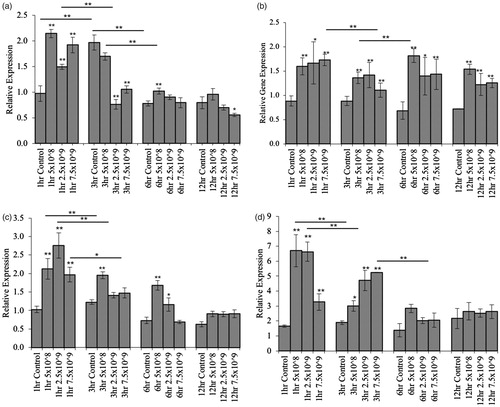
Table 6. Motility of Drosophila subjected to probiotics and/or prebiotic combinations.
Table 7. Variations in the human gut microbiota following prebiotic and/or probiotic treatment.
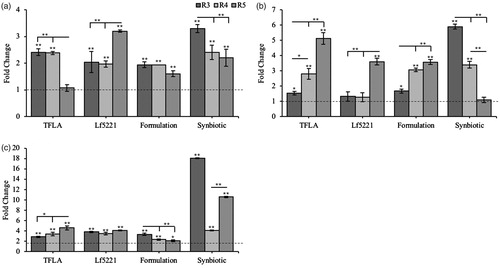
Figure 7. The probiotic and/or prebiotics alone or in combination alter the composition of the Drosophila microbiota. Variations in the aging Drosophila gut microbiota were assessed in flies inoculated with each of the individual probiotics (Lf5221, Lp8826 or Bi702255), TFLA or the probiotic or synbiotic formulations. Variations in the gut microbiota are represented by the ratio of relative gene expression from Day 0 to Day 30. Bacterial populations examined include (a) A. malorum, (b) A. pasteurianus, (c) A. aceti, (d) A. tropocalis, (e) A. cerevisiae, (f) L. breve, (g) L. plantarum and (h) Gluconobacter spp. Each group contained n = 5 independent samples and significance is marked as *p < .05 and **p < .01. Stars indicate significance relative to the normal-media control where bars indicate variations between groups.
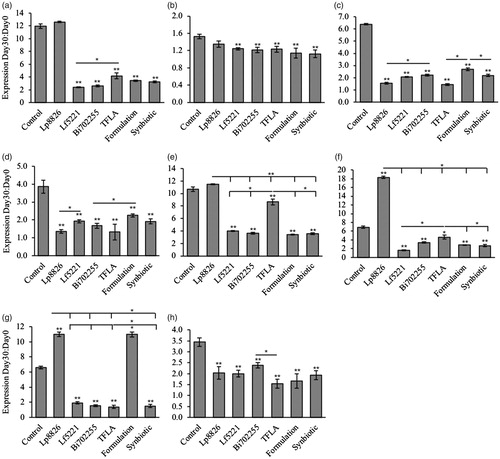
Figure 8. The probiotic and synbiotic formulations alter SCFA production in a humanized model of the GIT. Supernatant from the humanized in vitro model of the GIT was isolated and the levels of key SCFAs (a) acetate, (b) propionate and (c) butyrate were assessed using isocratic HPLC analysis in the ascending, transverse and descending colon compartments. Quantification is represented as the change in SCFA production from Day 0 to Day 21. Each group contains n = 5 independent samples and significance is marked as *p < .05 and **p < .01. Stars indicate significance relative to the normal-media control where bars indicate variations between groups.