Figures & data
Figure 1. Synthesis of DSPE-PEG2000-CC-ES.
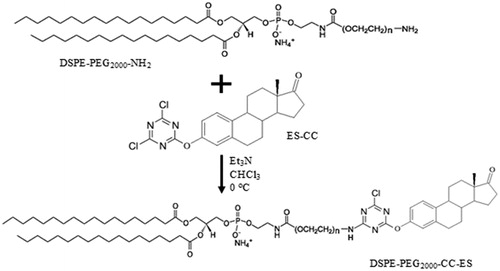
Figure 2. Normalized release profiles for DSPE-PEG2000-NH2 liposomes triggered by 20-kHz LFUS at three power densities. Results are average ± standard deviation of 2 liposome batches (3 replicates each).
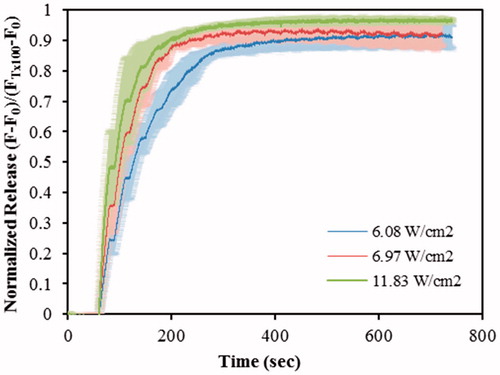
Figure 3. Normalized release profiles for DSPE-PEG2000-CC-ES liposomes triggered by 20-kHz LFUS at three power densities.
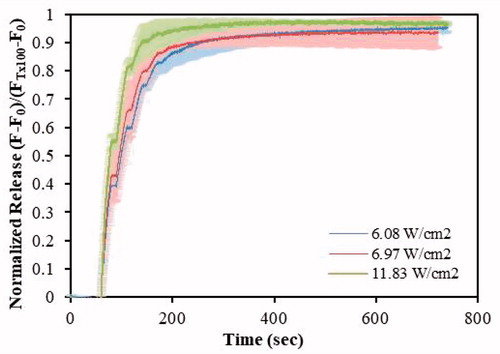
Figure 4. Comparison of calcein release from DSPE-PEG2000-CC-ES and DSPE-PEG2000-NH2 liposomes triggered by 20-kHz LFUS at the indicated power densities. (A) Release after the first US pulse, (B) Release after the second US pulse, (C) Final release.
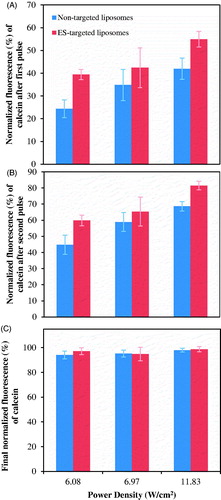
Figure 5. Normalized calcein release profiles from (A) DSPE-PEG2000-NH2 liposomes, (B) DSPE-PEG2000-CC-ES liposomes, triggered by 1.07 and 3.24 MHz HFUS, at the power densities indicated in the legend. Results are average ± standard deviation (3 replicates).
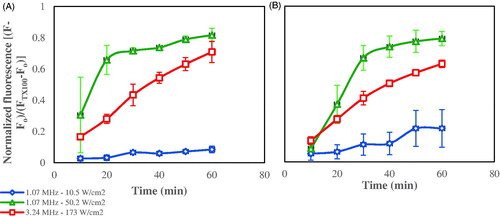
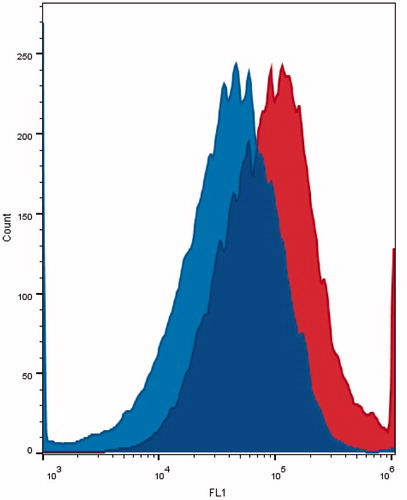
Figure 6. Calcein uptake of ER-negative MDA-MB-231 (on the left) and ER-positive MCF-7 (on the right) cells incubated for 30 min with ES-conjugated calcein liposomes.
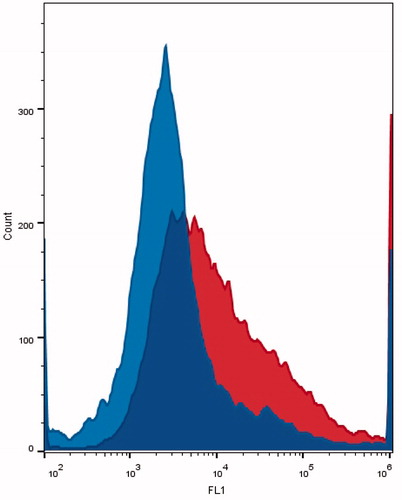
Figure 7. Calcein uptake of MCF-7 incubated with ES-conjugated liposomes before sonication (on the left) and after sonication (on the right). Ultrasound exposure conditions: 40-kHz water bath for 60 s (pulsed sonication at 10 s on and 20 s off cycles).