Figures & data
Figure 1. miR-326 is down-regulated in HCC tissues and cell lines. (A) miR-326 expression was significantly decreased in the primary HCC tissues. (B) miR-326 expression was lower in HCC cells when compared with that in normal liver cell line LO-2. (C) and (D) Low-level expression of miR-326 was associated with a shorter overall survival and disease-free survival time of HCC patients (The above and below curves represent high- and low expression of miR-326, respectively). *p Value<.05.
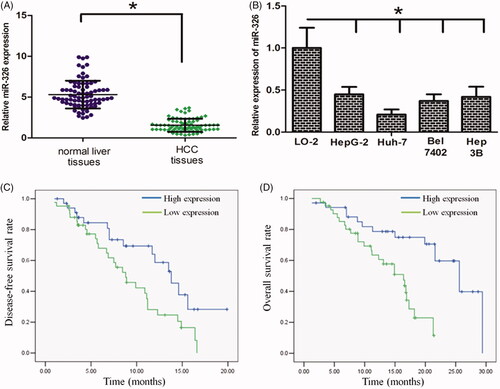
Table 1 Associations between lncRNA miR-326 expression and patients’ clinicopathological features.
Figure 2. miR-326 inhibition decreased HCC cell proliferation and invasion. (A) The MTT assay revealed that restoration of miR-326 decreased cell proliferation. (B) Colony formation assay demonstrated that oncogenic survival was significantly decreased in LV-miR-326 cells compared with LV-ctrl cells. (C) LV-miR-326 cells displayed a significantly higher frequency of cells at the G1 phase and a lower frequency of cells at S phase. (D) Restoration of miR-326 affected the expression of G1/S phase checkpoint proteins. (E) Restoration of miR-326 increased the proportion of apoptosis in HCC cells. (F) Restoration of miR-326 decreased the HCC cell invasion ability, as revealed by the Boyden assay. (G) The expression levels of MMP-2 and MMP-9 protein were lower in LV-miR-326 cells.
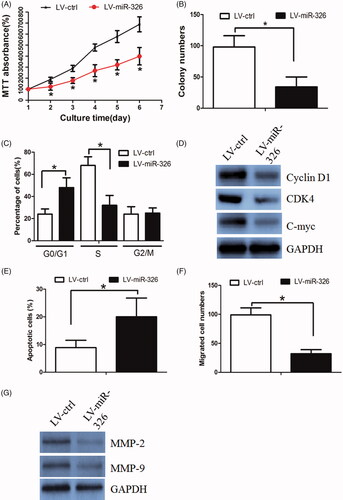
Figure 3. miR-326 repressed PDK1 expression in HCC cells. (A) The binding sites of miR-326 on PDK1. (B) The luciferase assay showed that cells transfected with miR-326 had less luciferase activity than those transfected with miR-ctrl. (C) miR-326 repressed PDK1 mRNA expression in HCC cells. (D) miR-326 repressed PDK1 protein expression in HCC cells.
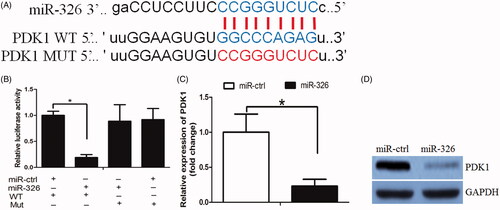
Figure 4. c-myc decreased miR-326 expression through biding at its promoter. (A)The putative transcription factor-binding site of c-myc at miR-326 promoter region. (B) c-myc down-regulation increased miR-326 expression. (C) c-myc down-regulation increased miR-326 promoter luciferase activity. (D) The CHIP assay confirmed that c-myc protein was recruited to the binding site in the putative miR-326 promoter. (E) miR-326 expression was negatively correlated with c-myc expression in HCC tissues. (F) and (G) PI3K inhibitor LY294002 decreased c-myc expression, while increased miR-326 expression in Huh7 cells.
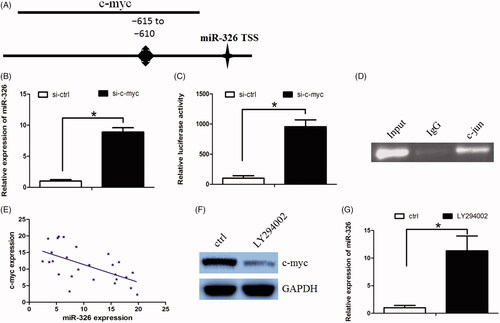
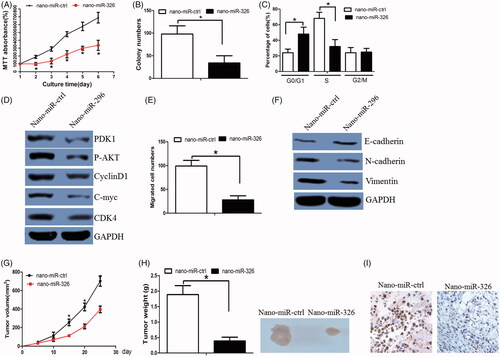
Figure 5. AuNPs delivered miR-326 decreased HCC cell growth in vitro and in vivo. (A) When treated by nano-miR-326, HCC cells growth was accordingly reduced. (B) nano-miR-326 treatment decreased Huh7 cells colony formation ability. (C) nano-miR-326 treatment led to cell cycle arrest at G1 phase. (D) PDK1, p-Akt, c-Myc, cyclinD1, and CDK4 expression levels were decreased in nano-miR-326-treated cells. (E) nano-miR-326 treatment decreased Huh7 cells migration ability. (F) The E-cadherin expression was elevated, while N-cadherin and Vimentin expression were decreased in nano-miR-326-treated cells. (G) nano-miR-326-treated Huh7 cells grew more slowly. (H) The mean weight of xenograft tumours was less in the nano-miR-326 group when compared with that in the nano-miR-ctrl group. (I) The KI-67 stain assay revealed that nano-miR-326 decreased Huh7 cell proliferation ability.