
Figures & data
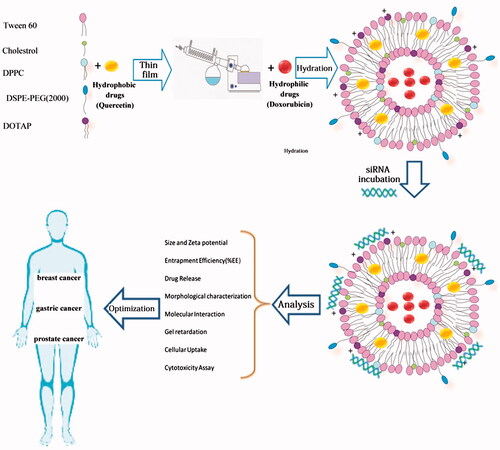
Figure 1. Schematic diagram of temperature and pH effects on cationic PEGylated niosome.
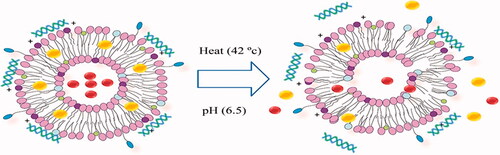
Figure 2. The scanning electron microscopy (SEM) of Nio-siRNA-DOX.
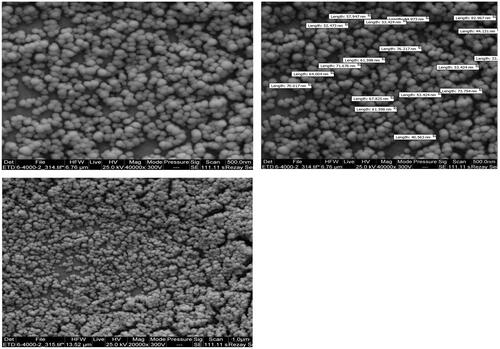
Table 1. The effect of tween-60:cholesterol and L/D ratio on EE%, the long-term and short-term release.
Table 2. The effect of various types of phospholipids on EE%, size, zeta potential and the release.
Figure 3. The drug release profile in various temperatures and pH.
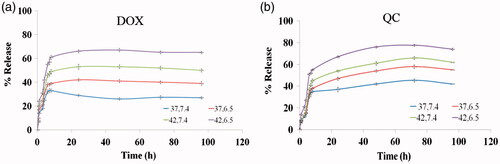
Figure 4. (a) Plot of theoretical amount of DOX release versus experimental data based on the Higuchi’s model; (b) plot of theoretical value of QC release versus experimental data versus based on the Higuchi’s model; (c) Higuchi release kinetics for DOX and QC; (d) zero order release kinetics for DOX and QC and (e) first order release kinetics for DOX and QC.
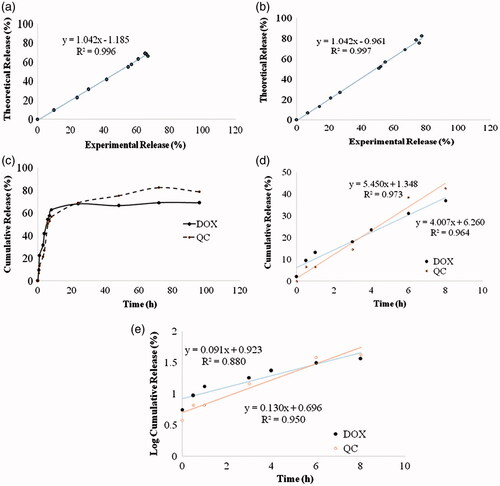
Table 3. Release kinetics data of DOX and QC from the niosomal optimum formulae.
Figure 5. FTIR spectra of (a) DOX; (b) QC; (c) Blank niosome; (d) Nio-siRNA; (e) Nio-DOX; (f) Nio-QC; and (g) Nio-siRNA-DOX-QC.
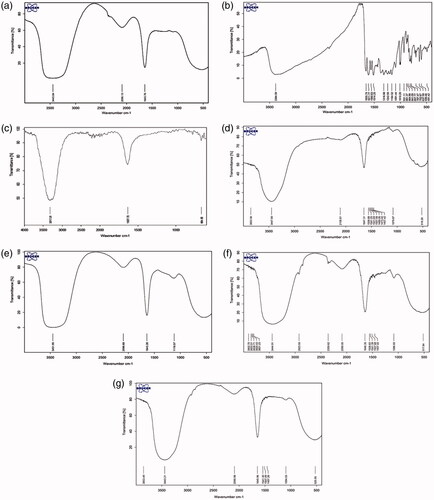
Figure 6. (a) Agarose gel electrophoresis of free siRNA (1 µg) and siRNA loaded in niosome vesicles to determine the most effective ratio of niosome: siRNA. (b) Monitoring of siRNA loading stability after 4 months storage at 4 °C.
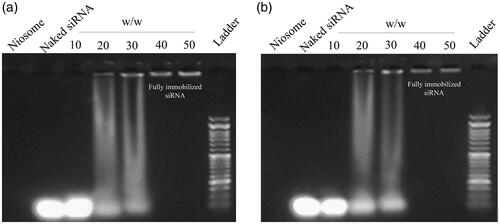
Figure 7. Cellular uptake images of AGS, PC3, MCF7 and HFF cells, incubated with DIL-labeled Niosome (DIL-Nio) for 30 min and 180 min. DAPI (blue) was used for nucleus staining and DIL dye (green) was used for phospholipid staining.
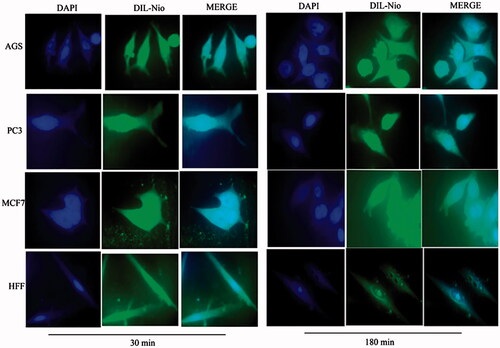
Figure 8. Cellular uptake images of AGS, PC3, MCF7 and HFF cells, incubated with free DOX for 30 min and 180 min. DAPI (blue) and DOX (red).
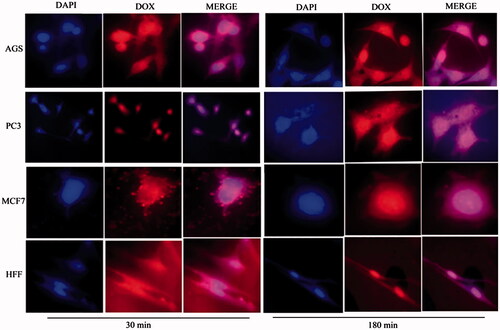
Figure 9. Cellular uptake images of AGS, PC3, MCF7 and HFF cells, incubated with DIL-Nio-DOX for 30 min and 180 min.
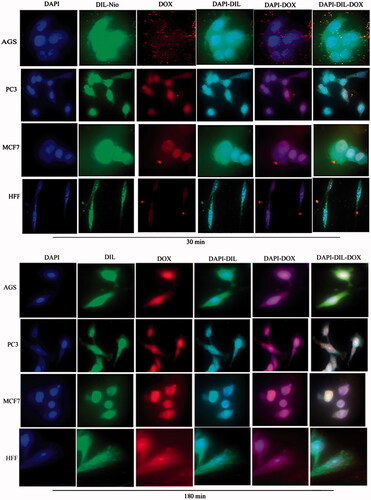
Figure 10. Cellular uptake images of AGS, PC3, MCF7 and HFF cells, incubated with (a) free QC and (b) DIL-Nio-QC for 30 min and 180 min. DAPI (blue) and QC (green).
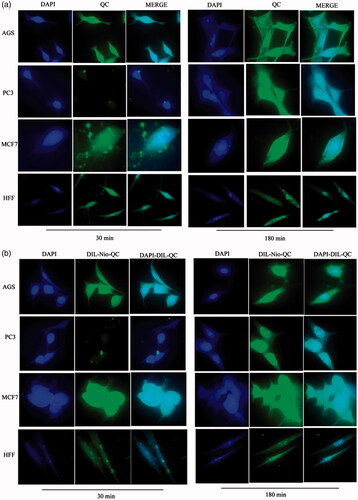
Figure 11. Cellular uptake images of AGS, PC3, MCF7 and HFF cells, incubated with free DOX and free QC for 30 min and 180 min.
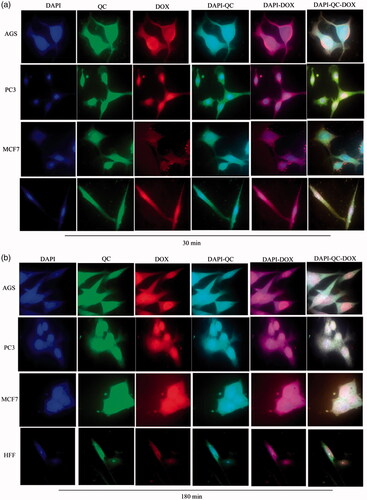
Figure 12. Cellular uptake images of AGS, PC3, MCF7 and HFF cells, incubated with Nio- DOX and Nio-QC for 30 min and 180 min.
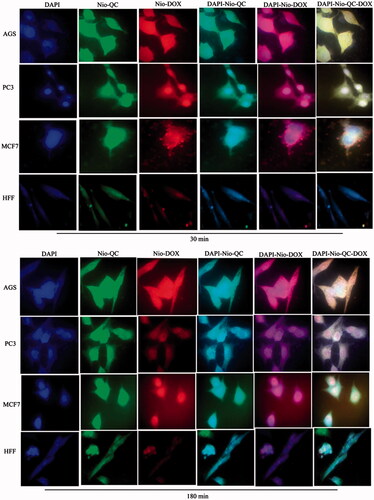
Figure 13. Cellular uptake images of AGS, PC3, MCF7 and HFF cells, incubated with (a) free siRNA and (b) Nio-siRNA for 30 min and 180 min. DAPI (blue) and FAM-labelled siRNA (green).
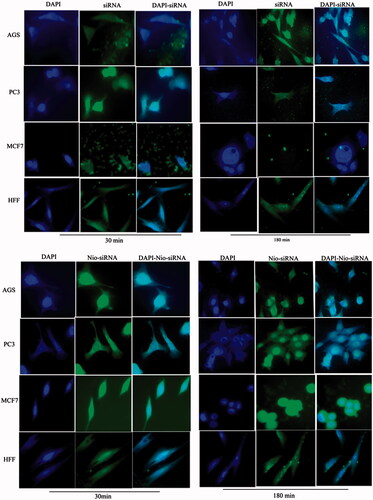
Figure 14. Survival analysis (a) Cytotoxicity of blank niosome, free siRNA, Nio-siRNA for AGS, PC3, MCF7 and HFF after 72 h; (b) comparison between toxicity of free DOX and Nio-DOX in various concentrations for AGS, PC3, MCF7 and HFF after 24, 48 and 72 h; (c) comparison between toxicity of free QC and Nio-QC in various concentrations for AGS, PC3, MCF7 and HFF after 24, 48 and 72 h.
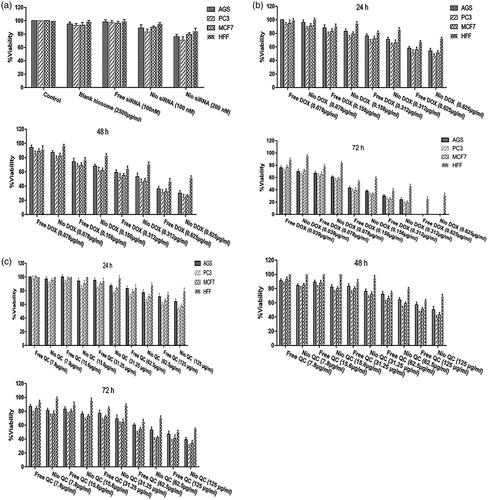
Figure 15. Comparison between cytotoxicity of 0.156 µg ml−1 Nio-DOX alone and combined with different concentrations of Nio-QC for 72 h (a) AGS; (b) PC3; (c) MCF7; and (d) HFF.
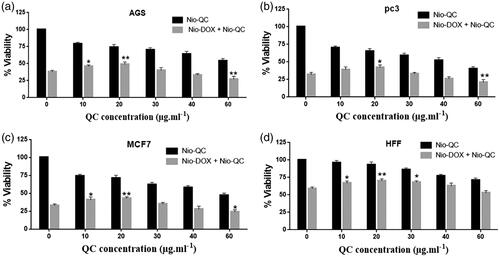
Figure 16. Comparison between cytotoxicity of different concentrations of Nio-DOX alone and combined with 20 µg ml−1 Nio-QC for 72 h (a) AGS; (b) PC3; (c) MCF7; and (d) HFF.
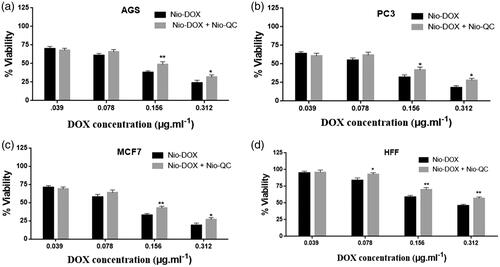
Figure 17. Comparison between cytotoxicity of Nio-DOX (0.156 µg ml−1) alone, combined with Nio-QC (40 µg ml−1) and co-delivery of Nio-siRNA (100 nM)-DOX (0.156 µg ml−1) with Nio-QC (40 µg ml−1) (triple combination therapy) for AGS; PC3; MCF7; HFF after 72 h.
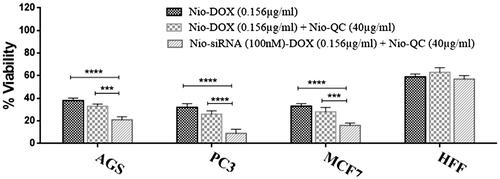
Table 4. The IC50 values of DOX and QC in the forms of free drug and drug niosomal form on AGS, PC3, MCF-7 and HFF cells after 72 h.
Table 5. The combination index of different concentration of QC in combinations with DOX.