Figures & data
Figure 1. The structures of NLCs and preparation process of Cel-Indo-NLCs-gel.
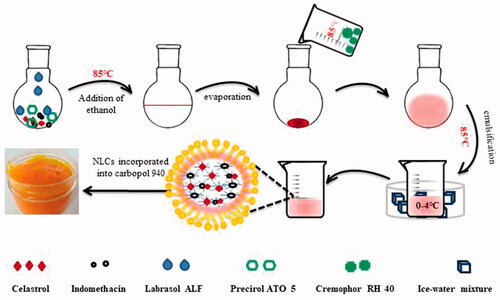
Table 1. Factors and levels for the experimental design.
Table 2. Randomized design and results for Box–Behnken design of total 17 experiments.
Figure 2. Equilibrium solubility of Cel and Indo in liquid (A) and solid (B) lipids.
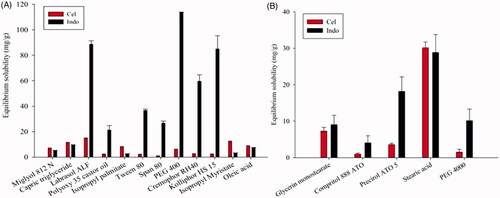
Table 3. Summary of the results of regression analysis for responses, and analysis of variance for particle size, mean EE and total DL.
Table 4. Predicted and experimental values obtained based on optimal formula generated by BBD (n = 3).
Figure 3. Size (A) and TEM (B) images of optimized Cel-Indo-NLCs.
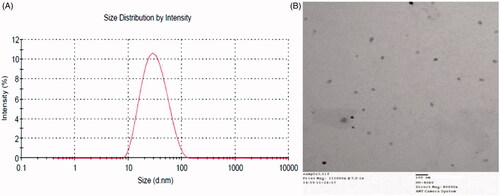
Figure 4. Fourier transform infrared spectra of Indo, Cel, Mixture (mixture of drugs and lipids), Blank-NLCs and Cel-Indo-NLCs.
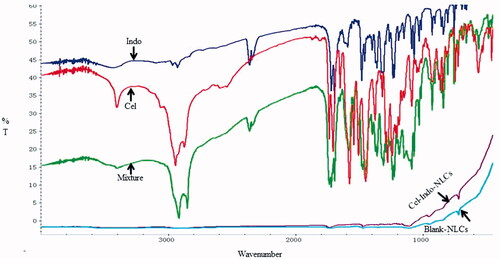
Figure 5. Powder X-ray diffraction patterns of Indo, Cel, Mixture (mixture of drugs and lipids), Blank-NLCs and Cel-Indo-NLCs.
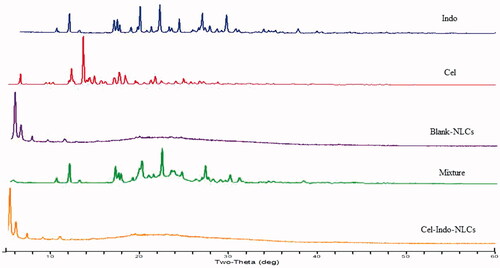
Figure 6. CLSM images of vertical section of the skin treated with Cel-Indo-NLCs at different time. The slides were stained with DAPI. White arrows indicate the hair follicles.
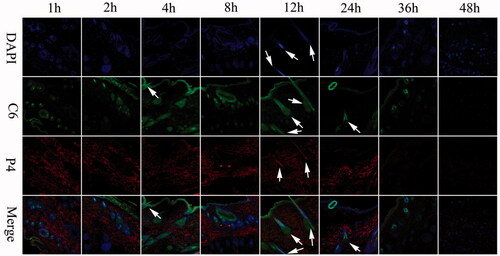
Figure 7. CLSM images of horizontal section of skins treated with Cel-Indo-NLCs at 24 h. The slides were stained with DAPI.
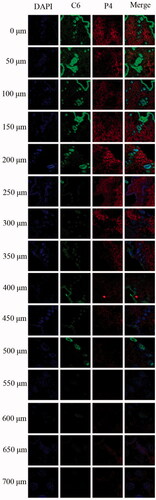
Figure 8. The transdermal delivery mechanism and depth of NLCs into skin.
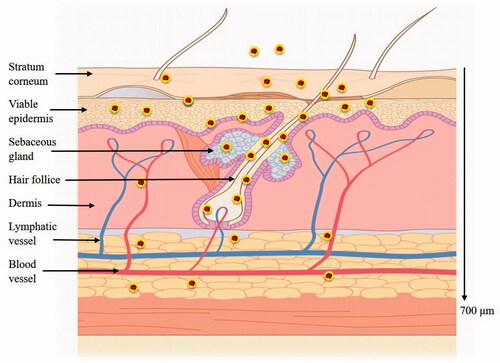
Figure 9. Rheological profiles of Cel-Indo-NLCs-gel.
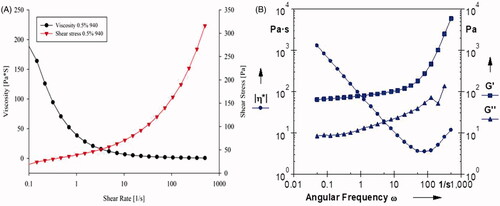
Figure 10. In vitro permeation profiles of Cel and Indo from Cel-Indo-NLCs and Cel-Indo-NLCs-gel through excised skins of rats.
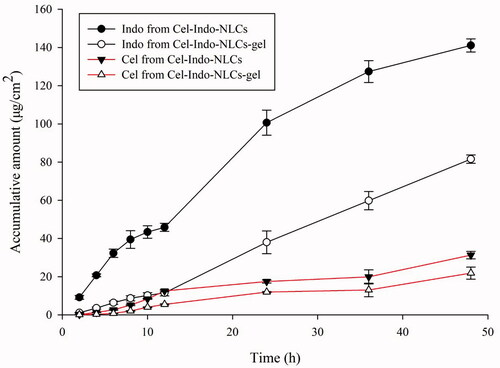
Figure 11. Effects of different administrations on paw volumes (n = 6).
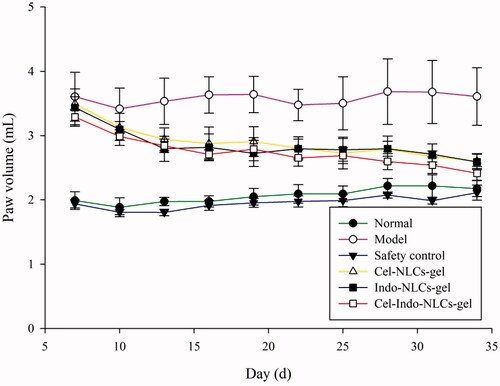
Figure 12. Effects of different treatments on serum levels of inflammatory and pain factors in rats. **p < .01, *p < .05 compared with the model group (n = 6). A, B, C, D, E and F respectively represent Normal (normal rats), Model (RA rats without treatment), Safety control (normal rats with Cel-Indo-NLCs-gel), Cel-NLCs-gel (RA rats with Cel-NLCs-gel), Indo-NLCs-gel (RA rats with Indo-NLCs-gel) and Cel-Indo-NLCs-gel (RA rats with Cel-Indo-NLCs-gel) group.
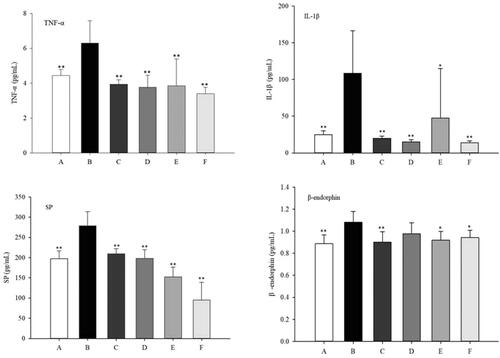
Figure 13. Effects of different administrations on paw appearances, histopathological images of ankle joints and skins. The degree of severity of inflammation is presented as 0 = normal; + =mild; ++=moderate; +++ =severe. The images presented are dedicated for (A) Normal (normal rats), (B) Model (RA rats without treatment), (C) Safety control (normal rats with Cel-Indo-NLCs-gel), (D) Cel-NLCs-gel (RA rats with Cel-NLCs-gel), (E) Indo-NLCs-gel (RA rats with Indo-NLCs-gel) and (F) Cel-Indo-NLCs-gel (RA rats with Cel-Indo-NLCs-gel) group.
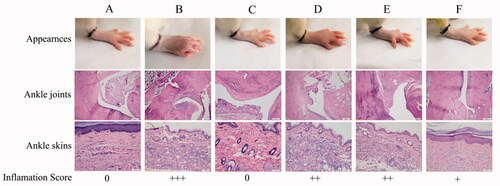
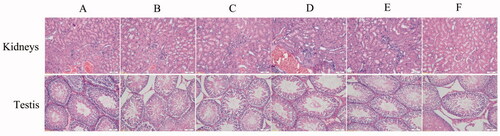
Figure 14. Histopathological images of kidneys and testis of different groups. The images presented are dedicated for (A) Normal (normal rats), (B) Model (RA rats without treatment), (C) Safety control (normal rats with Cel-Indo-NLCs-gel), (D) Cel-NLCs-gel (RA rats with Cel-NLCs-gel), (E) Indo-NLCs-gel (RA rats with Indo-NLCs-gel) and (F) Cel-Indo-NLCs-gel (RA rats with Cel-Indo-NLCs-gel) group.