Figures & data
Figure 1. Treatment with alcohol induces GINS2 production in rodent brain tissues and microglial cells. (A) RT-PCR analysis of GINS2 mRNA expression in the serum of 10 healthy people and 10 patients with alcohol abuse. (B) RT-PCR analysis of GINS2 mRNA expression in the brains of mice fed with alcohol (0% or 15%) for 3 weeks. (C) Western blot analysis of GINS2 protein expression in the brains of mice fed with alcohol (0% or 15%) for 3 weeks. (D) Body weight gain in mice fed with alcohol (0% or 15%) for 3 weeks. (E) RT-PCR analysis of GINS2 mRNA expression in mouse microglial cells treated with alcohol (0, 25, 50 or 75 mM). (F) Western blot analysis of GINS2 protein expression in mouse microglial cells treated with alcohol (0, 25, 50 or 75 mM). *p < .05 compared with the control group.
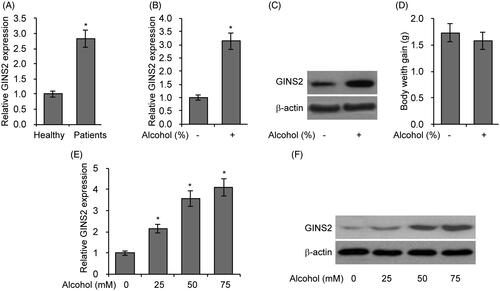
Figure 2. GINS2 knockdown enhances alcohol-induced oxidative pressure. (A) GINS2 protein expression measured by western blotting after GINS2 siRNA transfection. (B) ROS production levels measured by DCF-DA staining and flow cytometric analyses in mouse microglial cells treated or not treated with alcohol (75 mM) after GINS2 siRNA transfection. (C) MDA levels in mouse microglial cells treated or not treated with alcohol (75 mM) after GINS2 siRNA transfection. (D) SOD levels in mouse microglial cells treated or not treated with alcohol (75 mM) after GINS2 siRNA transfection. *p < .05 compared with the control group not treated with alcohol.
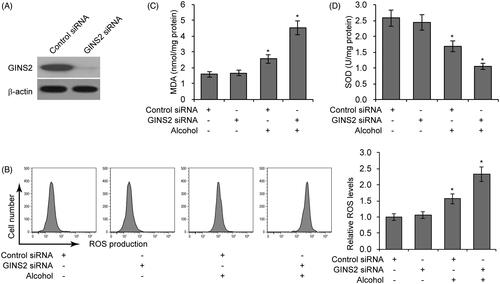
Figure 3. GINS2 knockdown increases ER stress in microglial cells treated with alcohol. (A) RT-PCR analysis of ATF4, CHOP and GRP78 mRNA expression in mouse microglial cells treated or not treated with alcohol (75 mM) after GINS2 siRNA transfection. *p < .05 compared with the control group not treated with alcohol. (B) Western blot of ATF4, CHOP and GRP78 protein expression in mouse microglial cells treated or not treated with alcohol (75 mM) after GINS2 siRNA transfection.
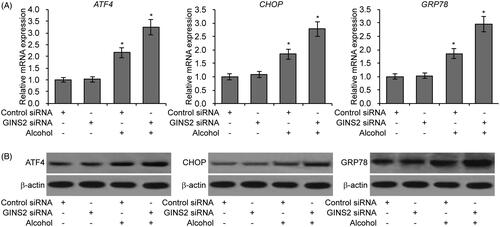
Figure 4. GINS2 knockdown decreases alcohol-induced apoptosis in microglial cells. (A–D) Cell viability (A), caspase-3 activity (B), caspase-9 activity (C) and TUNEL staining (D) assays in GINS2 knockdown microglia treated or not treated with alcohol (75 mM). *p < .01 compared with the control group not treated with alcohol.
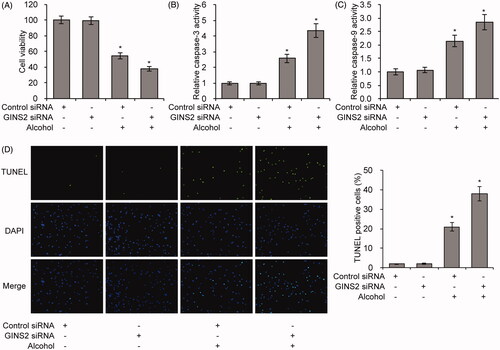
Figure 5. GINS2 knockdown promotes the expression of pro-inflammatory cytokines in microglial cells treated with alcohol. (A–F) RT-PCR analysis of IL-1β (A), IL-4 (B), IL-6 (C), IL-10 (D), TNF-α (E) and IFN-γ (F) mRNA expression in mouse microglia treated or not treated with alcohol (50 mM) after GINS2 siRNA transfection. *p < .01 compared with the control group not treated with alcohol.
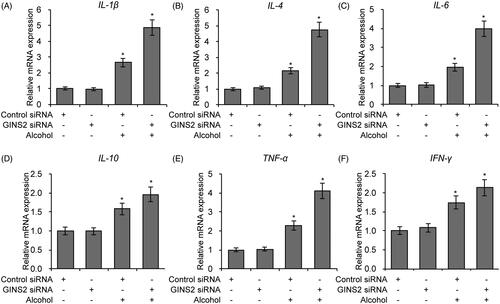
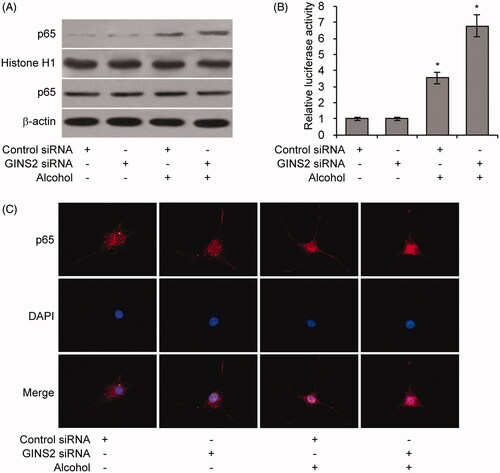
Figure 6. GINS2 regulates NF-κB Signaling. (A–C) Western blot analysis of nuclear p65 protein levels (A), Relative NF-κB luciferase activity (B) and Cell fluorescence staining of p65 (C) in mouse microglia treated or not treated with alcohol (50 mM) after GINS2 siRNA transfection. *p < .01 compared with the control group not treated with alcohol.