
Figures & data
Figure 1. Schematic presentation of the experimental procedures involving isolation and encapsulation of cells in FAMs and FMs.
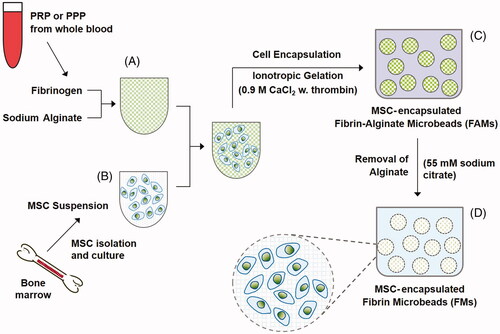
Figure 2. Schematic presentation indicating the in vivo experimental procedures.
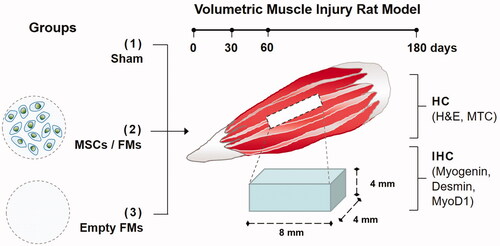
Table 1. Morphological scoring system of the muscles associated with stage of repair.
Figure 3. (A) FTIR spectra of FMs obtained from PPP and PRP, FAMs obtained from PRP and PPP, and sodium alginate. (B) Water uptake capacity of FMs and FAMs after 48 h. The data were statistically analysed by one-way ANOVA followed by Bonferroni's post hoc comparison tests (**p<.01). (C) SEM micrographs showing the surface, and cross-section structure of the fibrin microbeads.
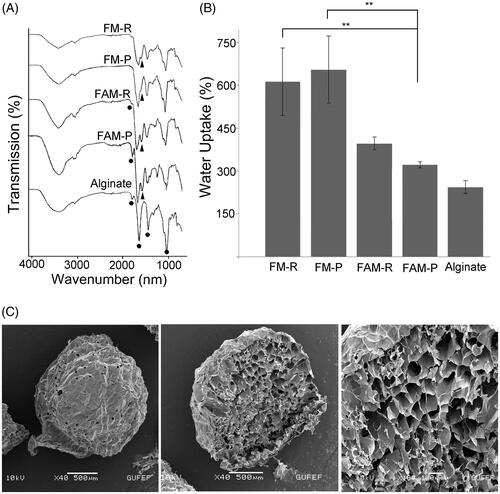
Table 2. Comparison of microbead yield, encapsulated cell content and size of different microbeads.
Figure 4. (A) Phase contrast micrographs of the MSC-encapsulated FM-R and FM-P at specific culture time points. (B) Viability of rat MSCs encapsulated in FM-R and FM-P. MTT data obtained were analysed by two-way ANOVA followed by Bonferroni's post hoc comparison tests (*p<.05).
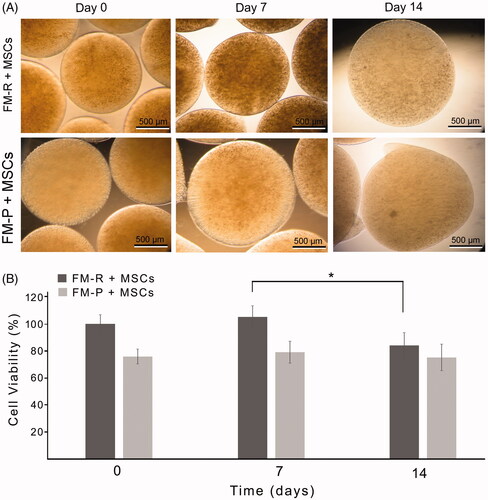
Figure 5. Macrographs showing (A) the created volumetric muscle loss of 8 × 4×4 mm3 at the rat biceps femoris muscle and (B) transplantation of fibrin microbeads into the VML site.
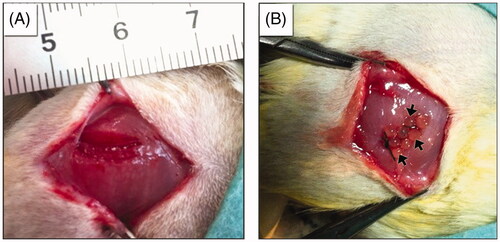
Figure 6. Representative H&E-stained sections of the muscle explants retrieved from subjects with VML injury at 30, 60 and 180 days post-transplantation. Asterisks indicate the microbeads, black arrows indicate the capillaries. Scale bars: 300 µm.
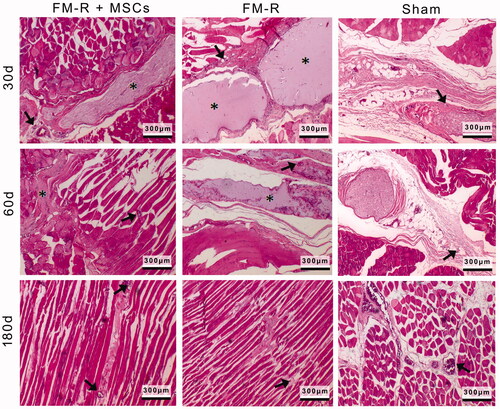
Figure 7. Representative Masson’s trichrome-stained sections of the muscle explants retrieved from subjects with VML injury at 30, 60 and 180 days post-transplantation. Collagen deposition (indicated with arrow heads) was evident between muscle fibres and microbeads (asterisks) in the FM-R and FM-R + MSCs groups at 30 and 60 days, whereas collagen deposition had decreased and muscle regeneration was noted after 180 days in these groups. However, in the Sham group, collagen deposition was strongly evident after 60 days, which later demonstrated an incomplete repair process with fibrotic scar tissue at 180 days. Scale bars: 300 µm.
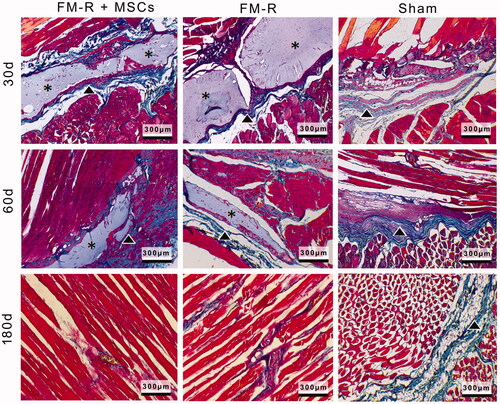
Figure 8. Representative anti-Desmin-stained sections of the muscle explants retrieved from subjects with VML injury at 30, 60 and 180 days post-transplantation. Scale bars: 300 µm.
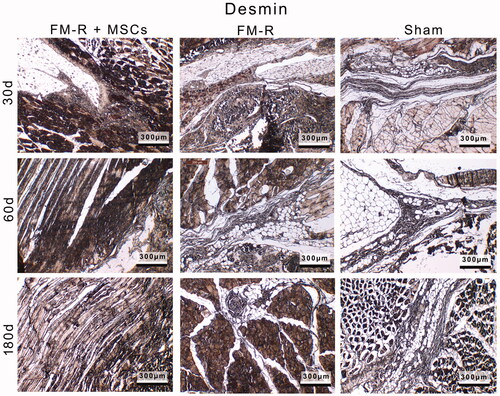
Table 3. Morphological scoring results of the muscles associated with stage of repair.