
Figures & data
Figure 1. HR-TEM analysis of (A) DCY51T-AuCKNps and (B) DCY65-AuCKNps which were derived from two different Lactobacillus strains: L. kimchicus DCY51T and L. brevis DCY65, respectively. HR-TEM analysis of model drug compounds derived from Lactobacillus kimchicus DCY51T. (C) DCY51T-DoxorubicinNps. (D) DCY51T-RifaximinNps.
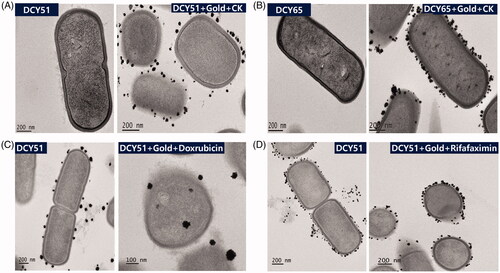
Figure 2. TEM analysis of (A) DCY51T-AuCKNps, (B) DCY51T-DoxorubicinNps and (C) DCY51T-RifaximinNps. TEM images of (a, b) DCY51T-AuCKNps, (f, g) DCY51T-DoxorubicinNps and (k, i) DCY51T-RifaximinNps. Gold distribution of (c) DCY51T-AuCKNps, (h) DCY51T-DoxorubicinNps and (m) DCY51T-RifaximinNps. SAED of (d) DCY51T-AuCKNps, (i) DCY51T-DoxorubicinNps and (n) DCY51T-RifaximinNps. EDX of (e) DCY51T-AuCKNps, (j) DCY51T-DoxorubicinNps and (o) DCY51T-RifaximinNps.
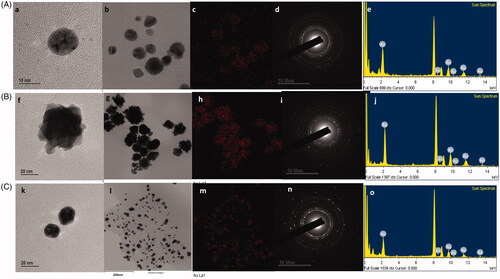
Figure 3. Particle size distribution (DLS) of the obtained nanoparticles with respect to intensity, number and volume. (A) DCY51T-AuCKNps. (B) DCY51T-DoxorubicinNps. (C) DCY51T-RifaximinNps.
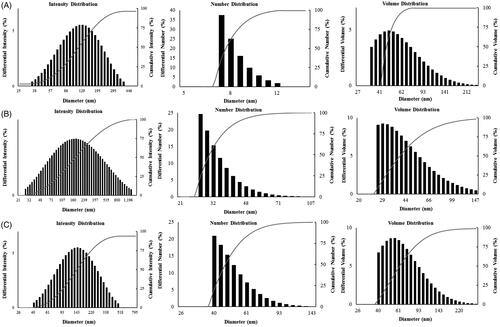
Figure 4. (A) UV–vis spectra of DCY51T-AuNps, with and without ginsenoside CK. (B) XRD spectrum of DCY51T-AuCKNps. (C) Photoluminescence of DCY51T-AuCKNps.
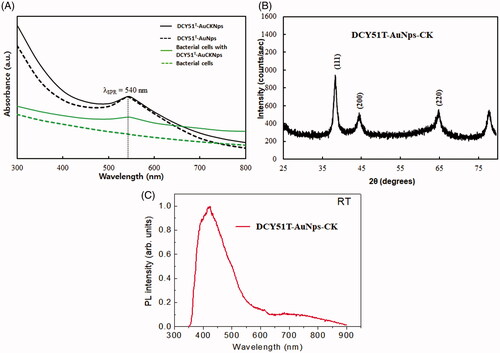
Figure 5. UV–vis absorbance spectra of the obtained nanoparticles depicting their high stability in various conditions due to protein capping. Stability of DCY51T-AuNps and DCY51T-AuCKNps against varied pH conditions (A, B) and electrolytic concentrations (C, D) and three-month storage (E, F), respectively.
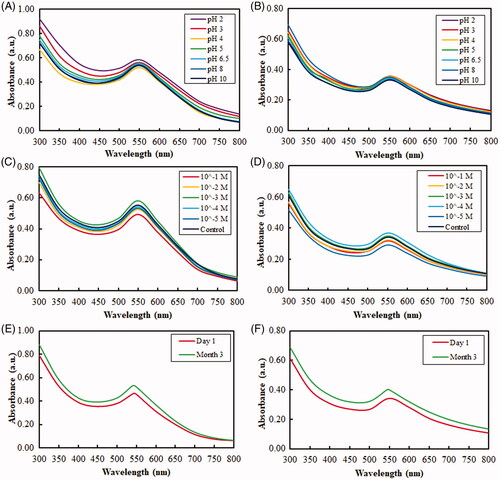
Figure 6. FTIR spectra of DCY51T-AuCKNps and proposed ginsenoside CK complexation onto the surface of DCY51T-AuNps. FT-IR spectra of DCY51T-AuCKNps revealed the presence of C–H bends (alkane groups) and C–O stretch (ethers) of ginsenoside CK.
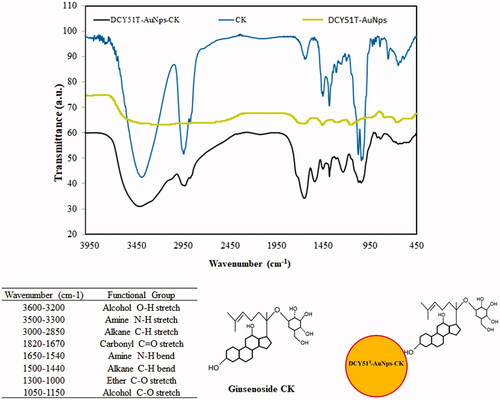
Figure 7. LC–MS spectra of ginsenoside CK released from DCY51T-AuCKNps after 24 h of sonication in DMSO-MeOH mixture (1:4, v/v). Inset distinguishes the ginsenoside CK released from the intracellular content of cell debris, supernatant, and purified DCY51T-AuCKNps.
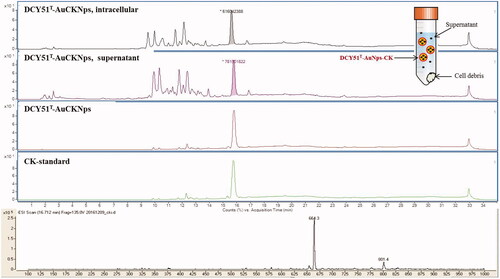
Figure 8. Cytotoxicity of DCY51T-AuNps after 48 h of incubation. (A) Macrophage cell line RAW264.7. (B) Keratinocyte cell line HaCaT. (C) Lung cancer cell line A549. (D) Colon cancer cell line HT29. Results are presented as means ± SDs.
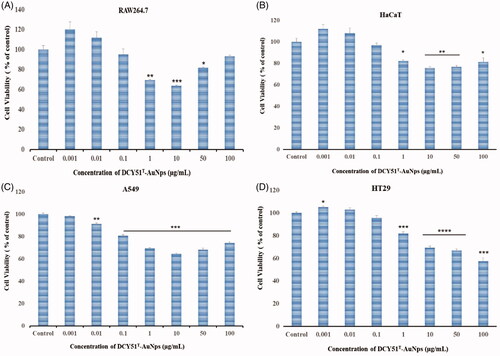
Figure 9. Antiproliferative activity (MTT assay) (A) of DCY51T-AuCkNPs on the cancer cell lines with and without treatment (B). Cytotoxicity of DCY51T-AuCKNps and ginsenoside CK after 48 h of incubation. (A) Macrophage cell line RAW264.7. (B) Lung cancer cell line A549. (C) Colon cancer cell line HT29. Results are presented as means ± SDs.
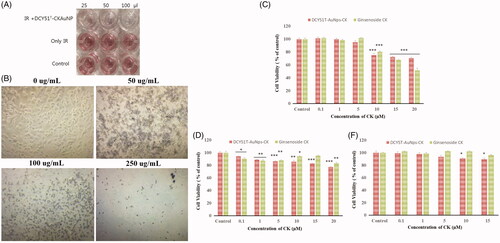
Figure 10. Detection of intercellular DCY51T-AuCKNps in the stomach cancer cell lines (AGS). (A) Control sample, (B) 800 nm laser treatment for 10 min. (C) DCY51T-AuCKNps + laser at 800 nm for 10 min.
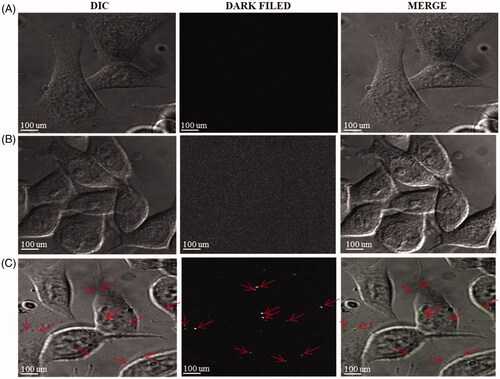
Figure 11. Fluorescent images of cells stained with Hoechst stain after an incubation time of Ankrum h. (A) Blank. (B) DCY51T-AuNps; 5 µg/mL. (C) DCY51T-AuCKNps; 1 µg/mL. (D) DCY51T-AuCKNps; 5 µg/mL. Apoptotic cells are indicated with white arrows. The scale bar equals 10 µm. There were more apoptotic cells in the DCY51T-AuCKNps groups than in blank or in the negative control (DCY51T-AuNps). The co-treatment groups of hyperthermia and chemotherapy exhibited the greatest number of apoptosis in cancer cells.
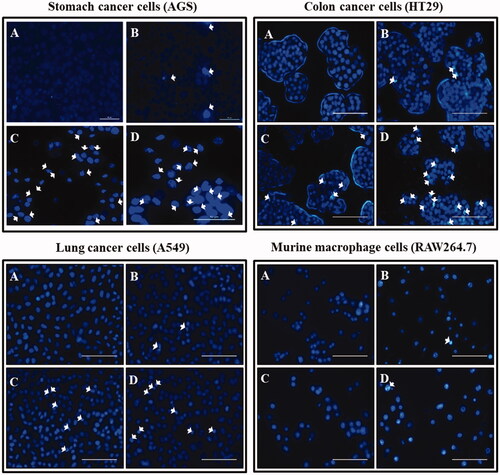
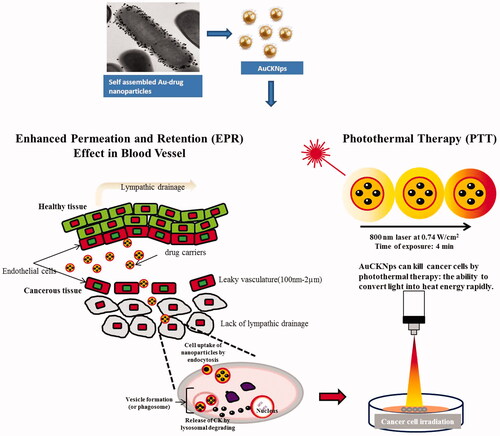
Figure 12. The proposed mechanism of cell internalization of DCY51T-AuCKNps by the EPR effect and in vitro photothermal therapy. DCY51T-AuCKNps reaches the cell membrane by exploiting the properties of the EPR effect. Following association with the cell by endocytosis, DCY51T-AuCKNps may aggregate on the anionic surface of cancer cells due to the cationic surface charge of the nanoparticles. In conjunction, DCY51T-AuCKNps can be irradiated to rapidly induce cell lysis.