
Figures & data
Figure 1 (A) UV-visible spectrum of SAG and SAG-Sh-SeNPs. Representative TEM image of Sh-SeNPs (B) and SAG-Sh-SeNPs (C).
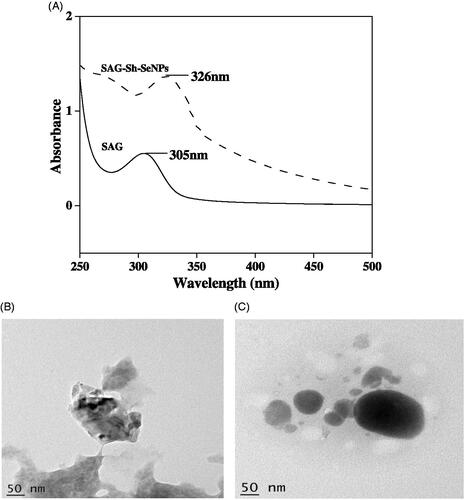
Figure 2 FTIR spectrum of (A) SAG and (B) SAG-Sh-SeNPs.
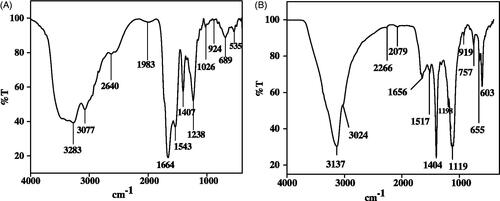
Table 1. Effect of NPs on the activities of liver-specific functional markers in serum and plasma against.
Table 2. Effect of NPs on the level of kidney-specific functional markers in serum of APAP-induced kidney toxicity in rat.
Figure 3 Effect of Sh-SeNPs and SAG-Sh-SeNPs against APAP toxicity-induced oxidative stress such as ROS generation, NO concentration, and lipid peroxidation in rat liver and kidney. Results are expressed as % variation in comparison to control animals as mean ± SD (n = 4 per group). *p < .05 vs. control; #p < .05 vs. APAP treated rat. The 100% value of NBT reduction, NO concentration and MDA concentration corresponds to, liver: 0.344 ± 0.009; kidney: 0.28 ± 0.08 OD at 630 nm/mg tissue, liver: 810 ± 24.52; kidney: 790 ± 21.82 n moles/mg of protein and liver: 0.08 ± 0.003; kidney: 1.01 ± 0.008 n moles/mg of protein, respectively. [![]()
![Figure 3 Effect of Sh-SeNPs and SAG-Sh-SeNPs against APAP toxicity-induced oxidative stress such as ROS generation, NO concentration, and lipid peroxidation in rat liver and kidney. Results are expressed as % variation in comparison to control animals as mean ± SD (n = 4 per group). *p < .05 vs. control; #p < .05 vs. APAP treated rat. The 100% value of NBT reduction, NO concentration and MDA concentration corresponds to, liver: 0.344 ± 0.009; kidney: 0.28 ± 0.08 OD at 630 nm/mg tissue, liver: 810 ± 24.52; kidney: 790 ± 21.82 n moles/mg of protein and liver: 0.08 ± 0.003; kidney: 1.01 ± 0.008 n moles/mg of protein, respectively. [Display full size Control; Display full size APAP; Display full sizeSh-SeNPs; Display full sizeSAG-Sh-SeNPs; Display full sizeSh-SeNPs + APAP; Display full size SAG-Sh-SeNPs + APAP].](/cms/asset/489bdec4-75d5-4b95-b281-590ae3c5679f/ianb_a_1543192_f0003_b.jpg)
Figure 4 Effect of Sh-SeNPs and SAG-Sh-SeNPs against APAP toxicity-induced decrease in non-enzymatic antioxidants (GSH and vitamin C) and enzymatic antioxidants (SOD, catalase and GPx) in rat liver and kidney. Results are expressed as % variation in comparison to control animals as mean ± SD (n = 4 per group). *p < .05 vs. control; #p < .05 vs. APAP treated rat. The 100% value of GSH and vitamin C content corresponds to, liver: 0.574 ± 0.070; kidney: 0.40 ± 0.03 n moles/mg of protein and liver: 7.118 ± 0.144; kidney: 6.75 ± 0.65 µg/mg of protein, respectively. The 100% value of SOD, catalase and GPx activities corresponds to, liver: 2.215 ± 0.158; kidney: 1.75 ± 0.2 U/mg of protein, liver: 0.84 ± 0.08; kidney: 0.52 ± 0.03 kU/mg of protein and liver: 2.529 ± 0.04; kidney: 1.23 ± 0.02 U/mg of protein, respectively. [![]()
![Figure 4 Effect of Sh-SeNPs and SAG-Sh-SeNPs against APAP toxicity-induced decrease in non-enzymatic antioxidants (GSH and vitamin C) and enzymatic antioxidants (SOD, catalase and GPx) in rat liver and kidney. Results are expressed as % variation in comparison to control animals as mean ± SD (n = 4 per group). *p < .05 vs. control; #p < .05 vs. APAP treated rat. The 100% value of GSH and vitamin C content corresponds to, liver: 0.574 ± 0.070; kidney: 0.40 ± 0.03 n moles/mg of protein and liver: 7.118 ± 0.144; kidney: 6.75 ± 0.65 µg/mg of protein, respectively. The 100% value of SOD, catalase and GPx activities corresponds to, liver: 2.215 ± 0.158; kidney: 1.75 ± 0.2 U/mg of protein, liver: 0.84 ± 0.08; kidney: 0.52 ± 0.03 kU/mg of protein and liver: 2.529 ± 0.04; kidney: 1.23 ± 0.02 U/mg of protein, respectively. [Display full size Control; Display full sizeAPAP; Display full sizeSh-SeNPs; Display full sizeSAG-Sh-SeNPs; Display full sizeSh-SeNPs + APAP; Display full sizeSAG-Sh-SeNPs + APAP].](/cms/asset/71c50209-7789-47ac-bff0-a64fc3b4ba51/ianb_a_1543192_f0004_b.jpg)
Figure 5 Effect of Sh-SeNPs and SAG-Sh-SeNPs against APAP toxicity-induced decrease in mitochondrial complex I (A) and complex III (B) activity in rat liver and kidney. Results are expressed as % variation in comparison to control animals as mean ± SD (n = 4 per group). *p < .05 vs. control; #p < .05 vs. APAP treated rat. The 100% value of complex I and complex III activities corresponds to, liver: 0.725 ± 0.101; kidney: 0.55 ± 0.1 µmoles/min/mg of protein and liver: 1.017 ± 0.05; kidney: 0.87 ± 0.04 µmoles/min/mg of protein, respectively. [![]()
![Figure 5 Effect of Sh-SeNPs and SAG-Sh-SeNPs against APAP toxicity-induced decrease in mitochondrial complex I (A) and complex III (B) activity in rat liver and kidney. Results are expressed as % variation in comparison to control animals as mean ± SD (n = 4 per group). *p < .05 vs. control; #p < .05 vs. APAP treated rat. The 100% value of complex I and complex III activities corresponds to, liver: 0.725 ± 0.101; kidney: 0.55 ± 0.1 µmoles/min/mg of protein and liver: 1.017 ± 0.05; kidney: 0.87 ± 0.04 µmoles/min/mg of protein, respectively. [Display full sizeControl; Display full sizeAPAP; Display full sizeSh-SeNPs; Display full sizeSAG-Sh-SeNPs; Display full sizeSh-SeNPs + APAP; Display full sizeSAG-Sh-SeNPs + APAP].](/cms/asset/bfa37c99-c9ff-4963-be48-c8f012ca59c2/ianb_a_1543192_f0005_b.jpg)