Figures & data
Table 1. Primer sequences of genes in quantitative real-time PCR assay.
Figure 1 Scanning electron microscopic image: (A) chitosan nanogel contain farnesol and (B) alginate nanogel contain farnesol.
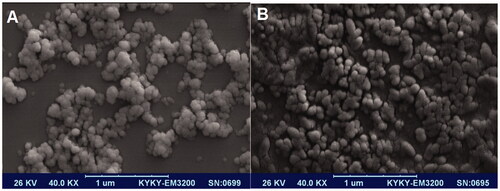
Figure 2 Fourier-transform infrared spectra: chitosan nanogel contain farnesol.
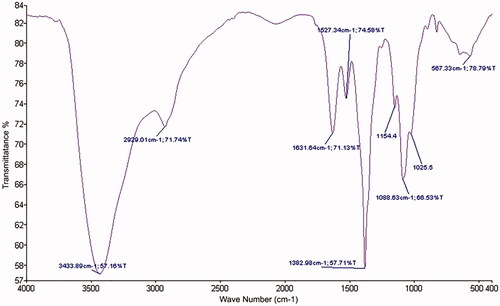
Figure 3 Fourier-transform infrared spectra: alginate nanogel contain farnesol.
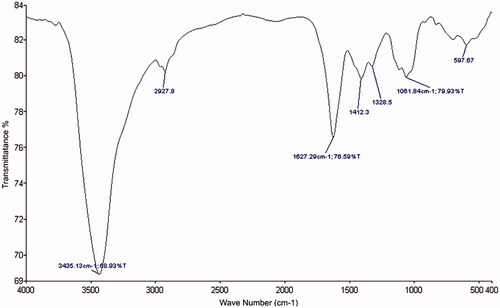
Figure 4 (A) XRD spectra of chitosan nanogel contain farnesol and (B) XRD spectra of alginate nanogel contain farnesol.
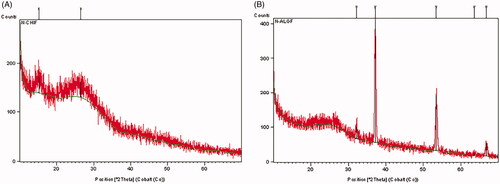
Figure 5 Farnesol release kinetics. Farnesol-loaded chitosan and alginate nanogels at pH 7.
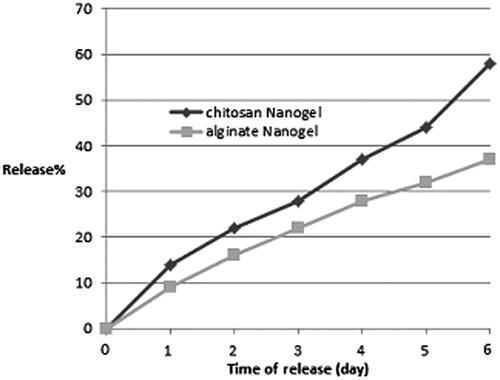
TABLE 2. Minimum inhibitory concentration 90 (MIC90) of farnesol on C. albicans (ATCC 10231) growth rate.
TABLE 3. Inhibitory zone of farnesol and nanogels contains farnesol in pure plat assay.
Figure 6 Cytotoxicity effect of farnesol and farnesol-loaded nanogels on SW480 cells by MTT assay during 12, 24, 48 and 72 h treatment. Results indicated no differences significant cell viability per cent between each of treatment compared to control without treatment. *The difference between groups is statistically significant.
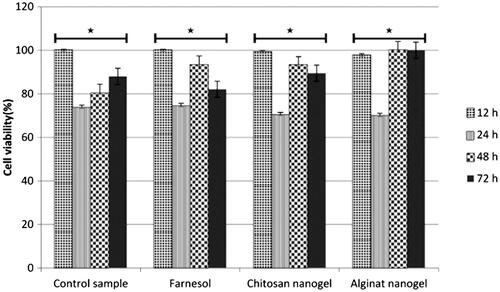
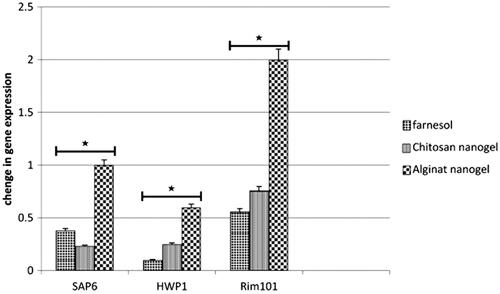
Figure 7 Comparison of gene expression pattern of HWP1, SAP6 and Rim101 of C. albicans compared with ACT1 gene (housekeeping gene) before and after treatment with farnesol and nanogels containing farnesol. Changes in gene expression of HWP1, SAP6 and Rim101 are presented, compared to treatment with farnesol and nanogel. *The difference between groups is statistically significant.